.svg)
Infogram is an intuitive tool for data visualization. It helps users in a variety of ways
It's a powerful service that makes it easy to transform data into engaging visualizations like graphs, charts, and presentations. Here are a few key facts about Infogram:
It is suitable for marketers, social media managers, media companies, and strategic business leaders who want to create data-driven content like infographics.
Infogram is a feature-rich service designed to turn raw data into informative and engaging visualizations.
Here is a detailed review of the key features offered by the Infogram service, organized and numbered for greater clarity.

Data visualization is at the heart of the Infogram service, allowing users to create interactive charts, maps, and more.
With these tools, turning your data into engaging visualizations is within everyone's reach.

The Infogram service offers intuitive design tools that make it effortless to create engaging visualizations.
These features make creating engaging designs much easier, even for design novices.
Data management is simplified with the flexible online import and export options offered by the Infogram service.
With these features, managing and sharing your data has never been easier.

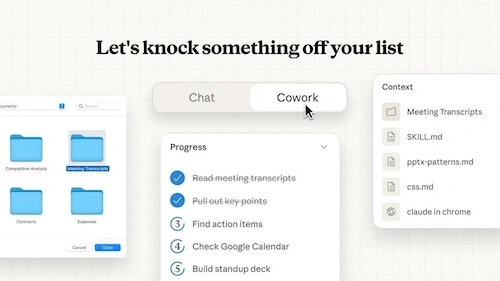
The Infogram service promotes team collaboration and content creation through features that enable effective and controlled collective work.
Team collaboration is made smooth and effective, thus promoting productivity and creativity.

Infogram makes it easy to publish your visualizations on a variety of online platforms, increasing your visibility.
Learn how Infogram can help you share visualizations with a wider audience.

Create engaging dashboards that will impress colleagues and customers, while keeping data always up to date.
Infogram is a reliable companion for all your visual communication needs, offering a range of features that make it adaptable to a variety of business needs. Its flexibility and power make it an invaluable tool for those looking to communicate information in a visual and interactive way.
Infogram is a renowned tool for creating charts, reports, and interactive infographics with ease.
Infogram pricing is structured to accommodate a variety of users, ranging from individuals to large businesses. Here's an overview of Infogram's pricing plans to help you choose the one that fits your needs.
Infogram takes data security and privacy seriously. Here are a few key points:
Infogram strives to maintain a secure environment for all of its users.
Infogram offers responsive and informative customer support:
With Infogram, you're never alone with your data visualization challenges.
Yes. Feel free to use the pro, business, or enterprise plans.
These have higher usage limits and lots of features that allow you to visualize unlimited data and infographics for your business.
The free data visualization tools in the basic plan are for non-commercial uses only, such as blogs, personal projects, and presentations.
Infogram takes the privacy and security of its users very seriously. With a historical uptime of 99.8% of mirrored services, Infogram's system ensures the security of all user data.
Plus, with Pro or Business plans, you can choose to privately share your password-protected projects with others.
When it comes to creating engaging infographics and interactive reports, one of the best tools to use in today's market is Infogram. It caters to users thanks to its easy to navigate interface and user-friendly services. Its main features allow you to create fully responsive infographics and offer very effective visuals. If you need help making data and information fun and visually appealing, you can definitely consider Infogram.
Not only are you equipped to create creative logos or graphics, but you can also collaborate with team members in real time. You can also upload, share, and post online. This gives you more opportunities and possibilities to optimize collaboration and teamwork. Ultimately, Infogram provides users with the tools and features they need to captivate your audience with stunning visuals.


-2-2.avif)

