.svg)
Piktochart started as an innovative solution to make data visualization and the simple creation of presentations accessible to everyone. Founded by Ai Ching Goh and Andrea Zaggia, the application quickly gained popularity thanks to its user-friendly interface and intuitive tools.
Piktochart offers a platform where users can create infographics, reports, presentations, and posters with ease, even without graphics or design skills.
Piktochart stands out for its ease of use and its varied design tools that democratize graphic design, making visual creation accessible to all professionals, regardless of their design skills.
Piktochart is aimed at a wide range of users, from marketers and educators to small businesses and NGOs.

Piktochart adapts perfectly to the varied needs of its users, offering a versatile and simple platform for creating visual content.
Piktochart excels at turning complex data into engaging visuals thanks to its customizable infographics.
This feature is perfect for professionals looking to simplify complex information while captivating their audience.

It revolutionizes the way information is presented by making slides interactive and visually engaging.
These tools are essential to energize your presentations, making them more memorable and effective.

With this software, produce reports and posters that clearly communicate your messages in a visually engaging format.
These tools facilitate the communication of important information in a concise and engaging manner, which is essential in the modern professional world.

He also excels at visualizing data, making complex analysis accessible and understandable.
This feature is a crucial asset for professionals and businesses who want to communicate their data analytics effectively.

It promotes collaboration by allowing multiple users to work together on projects.
These features transform Piktochart into a collaborative tool, increasing team productivity and efficiency.

It integrates easily with other tools and platforms, increasing its functionality and adaptability.
The integrations extend the capabilities of Piktochart, making the site more flexible and convenient for users.
They offer robust customer support to ensure a smooth user experience.
Piktochart's customer support is effective, ensuring fast help and a reliable tool for users.

Piktochart offers flexible web pricing plans to meet the needs of different users.
Piktochart pricing is designed to provide great value, with colors and options to suit a variety of budgets.

Canva is a graphic design platform known for its ease of use and versatility, ideal for creating a wide variety of visual designs.
Features
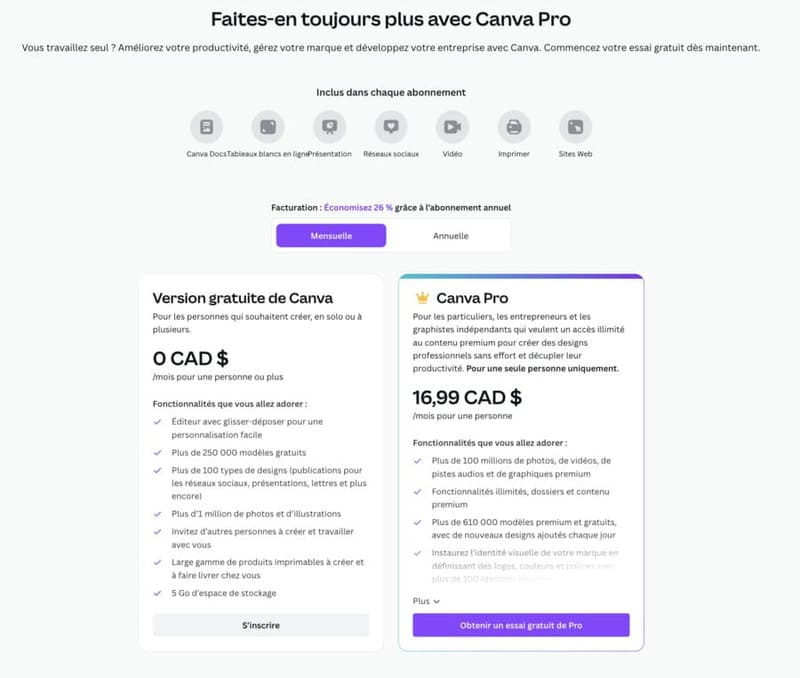
Pricing
Canva is a robust alternative to Piktochart, offering easy use and an extensive template library, well suited to a wide range of users.

Visme specializes in data visualization and interactive presentations, targeting professionals looking to create dynamic visual content.
Features

Pricing
Visme is a great alternative to Piktochart for those who require more sophisticated tools for data visualization and interactive presentations.

Adobe Express, formerly known as Adobe Spark, is a comprehensive graphic design solution integrated into the Adobe ecosystem.
Features

Pricing
Adobe Express is a powerful alternative to Piktochart, offering advanced design tools and seamless integration with other Adobe products, ideal for those looking for a richer creative experience.
Piktochart is designed to be intuitive, even for users with no design experience. Its drag-and-drop interface makes it easy to create complex visuals.
Yes, with its advanced features and collaboration options, Piktochart is perfectly suited to the needs of creating infographics for large businesses.
Piktochart proves to be a complete and accessible solution for creating presentation visuals and videos.
Its strengths lie in its ease of use and the variety of its tools. While there are alternatives like Canva and Visme, Piktochart is distinguished by its specialization in creating infographics and reports, making it particularly useful for professionals looking to present data in a clear and engaging way.


-2-2.avif)

