.avif)
.svg)


YouTube Analytics Basics
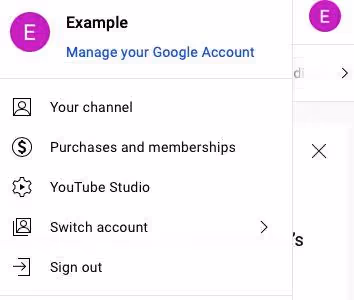
There are two ways to access YouTube Analytics. The first is to go to Youtube.com/analytics. You can also sign in to your YouTube account and click on the account icon. Once logged in, select “Creator Studio” and then “Analytics” on the right.
Under Analytics, you'll find several categories: Overview, Real-time, Watch Time Reports, Audience Retention, Demographics, etc. Let's take a look at some of the most important categories so you can use them for your social video strategy.
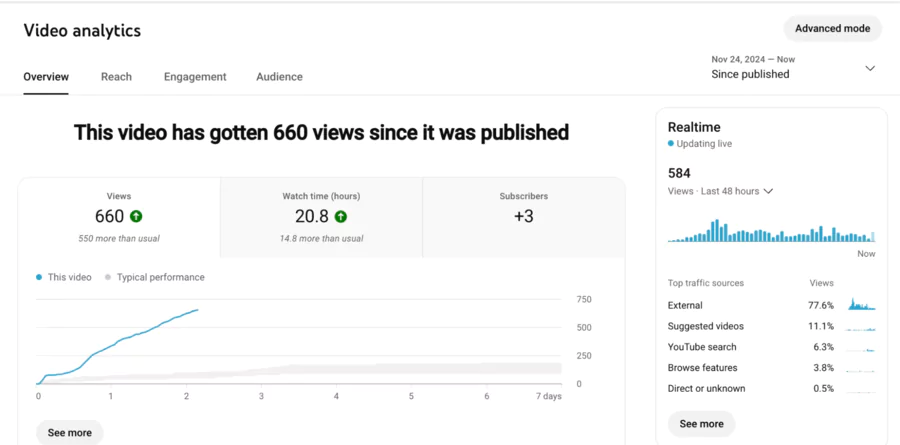
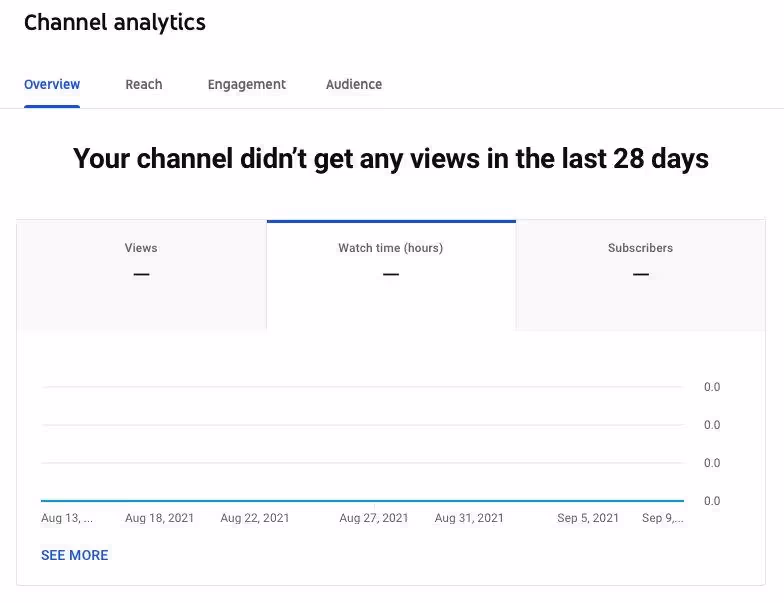
Overview
The general report provides you with a detailed summary of how your video has performed on YouTube over the past 28 days. You'll be able to see how various performance metrics, such as watch time, average viewing time, etc. have changed over this period of time. The report also shows your audience demographics to help you understand how well you are reaching your target audience.
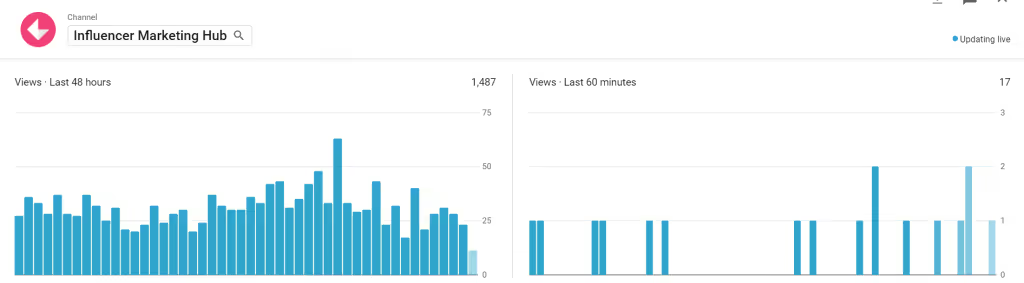
Real time
With the real-time report, you can get estimated visualization data from your five most recent videos. This can help you understand how your latest content is working and whether your current promotion strategy is effective. For example, if a certain video isn't working well, you can check to see if there's a problem with your targeting or cross-promotion efforts.
Standby time reports
When you create videos, you're doing it with the intention of getting people to watch them. So it's natural that watch time is one of the most important metrics you'll track.
But in addition to that, you'll need to follow other metrics that determine how engaging your audience is with your videos. YouTube Analytics provides you with information like audience retention, where they're reading, traffic sources, and more.
Viewing time
The Watch Time report gives you a very accurate overview of how your video is being watched. It collects data from YouTube mobile applications and the embedded player, in addition to YouTube.com.
In this category, you can see several important indicators such as the average viewing percentage, the average viewing time, the number of unique viewers for a given video, the estimated number of viewing minutes, etc.
Audience retention
As the name suggests, the Audience Retention Report helps you measure the ability of your video to retain your audience. You can use it to understand if your viewers finish watching your videos before leaving. If not, how many of them did they watch before deciding to leave?
And if you find that your videos are not retaining your audience well, it would be wise to consider refreshing things a bit. Are your videos too long? Maybe your intro isn't compelling enough. Or maybe your text isn't really helpful.
Try to change things up a bit based on which videos have the highest retention rates and see how things work out.
There's an absolute audience retention report that you can use to discover the most popular parts of the video. According to youtube, you should prioritize improving the first 15 seconds of your videos because users tend to drop out at that point.
You can also use the Relative Audience Retention Report to compare your video to similar videos on YouTube in terms of viewer retention.
On top of that, you can even visualize audience retention based on traffic type. This involves visualizing the audience retention rate for organic and paid traffic. Even among paid traffic, you can see differences in traffic retention rates for paid display ads and paid skippable video ads.

Demographic data
You can use the demographic report to understand the gender and age distribution of your audience. You can then filter the data based on the viewing habits of the demographic groups that interest you the most.
For example, you can see which of your videos seem to be the most viewed by women between the ages of 13 and 17.
This information can help you determine what type of content you need to create to appeal to a certain demographic group. You can also find out what types of videos seem to work well across demographics.
Reading locations
This report gives you an overview of the pages and sites where your videos are watched. This report is particularly useful if you work with partners or collaborators. It gives you a clear idea of how many views you're getting directly on YouTube, through other websites, and through embedded videos. You'll also be able to determine how many YouTube views have taken place on the specific video page or on a channel page.
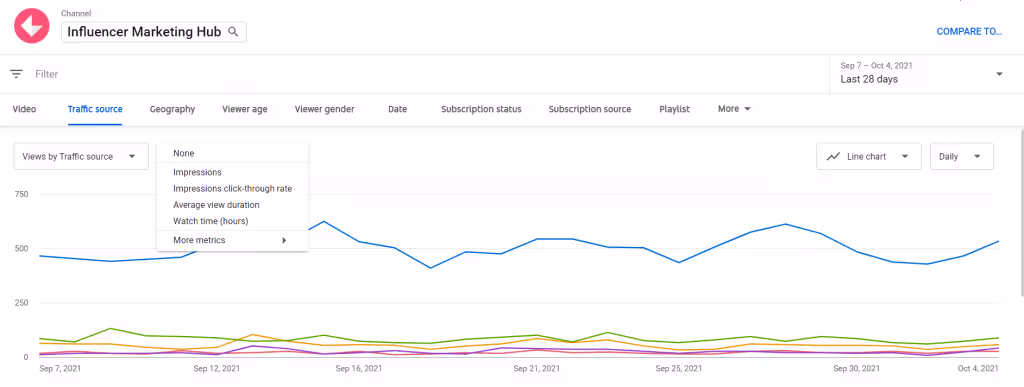
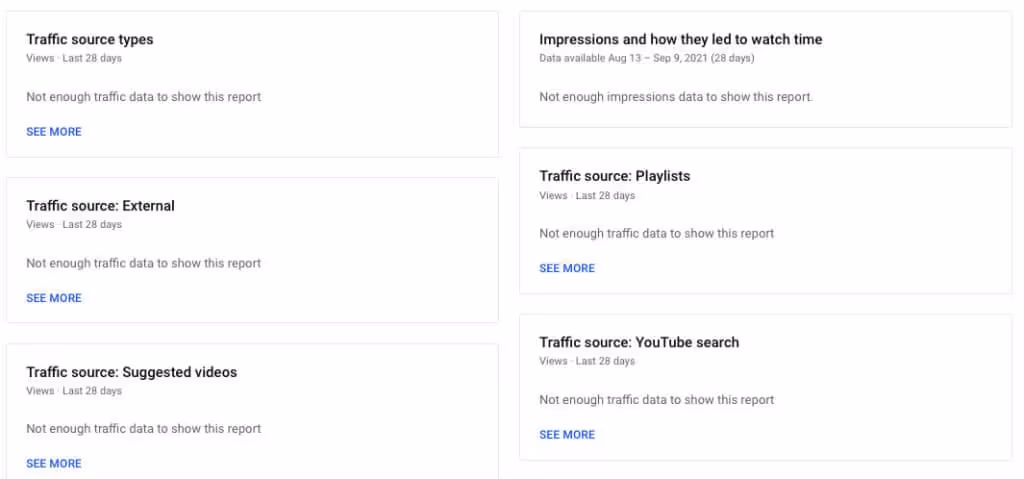
Traffic sources
As the name suggests, the Traffic Sources report gives you information about the YouTube sites and features that your viewers used to find your content. This information can help you understand the different ways viewers find videos.
For example, you can see if your audience is finding your content by searching directly on YouTube or through suggested videos. You can also see how much traffic you're getting through social networking sites.
This is very useful for social media marketers, as you'll be able to improve your efforts if you discover low social traffic on your YouTube videos.
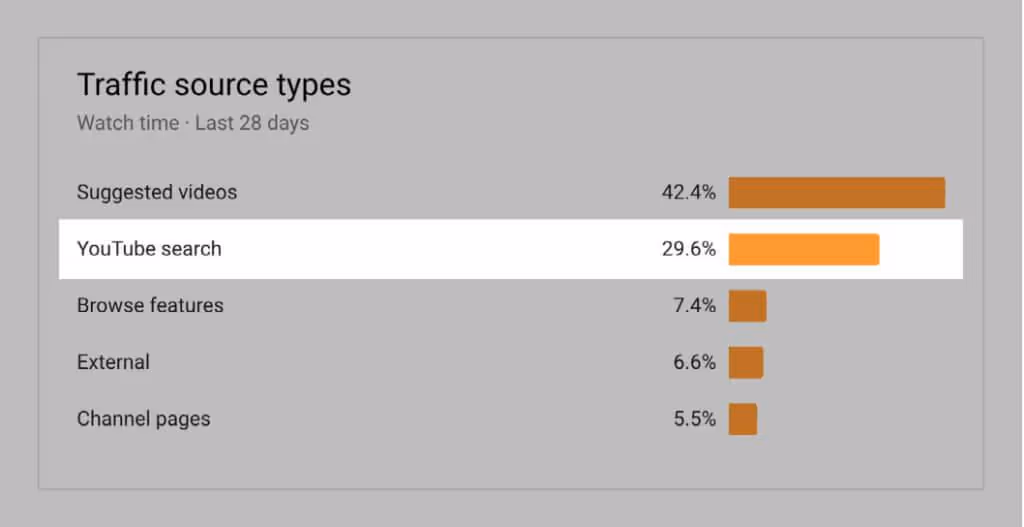
The various traffic sources you can track include YouTube search, video suggestions, navigation features, playlists, channel pages, YouTube ads, video maps/annotations, notifications, campaign maps, end screens, etc. And these are just internal traffic sources. In addition to these, you can also track external traffic sources.
Devices
Another important report is the device report, which allows you to see what devices your audience is using to view your videos. You'll be able to see how many views are coming from different devices like computers, cell phones, game consoles, TVs, etc. And you can see the viewing time for each of these devices.
It's critical to understanding how your videos perform across devices. If you notice that the viewing time is much lower on mobile, for example, that may be a sign that you need to shorten your videos to make them easier to view.
Why is YouTube Analytics critical for measuring the performance of paid content and ads?
YouTube generated 19.77 billion dollars advertising revenue in 2020. Predating both Instagram and Facebook, it introduces the better return on investment for video content. Done right, YouTube ads are a profitable business.
But you can also accumulate significant exposure and revenue through an organic strategy on YouTube. The best practice is to start with an organic strategy, understand what techniques work for your content, and then reinforce the paid strategy.
In either case, you need to understand if your content and paid media efforts are performing well. YouTube Analytics has four key reporting areas:
- Overview
- Reach
- Commitment
- Audience
As with most platforms, there are measures that matter, and measures of vanity.
For ASO, this happens when you prioritize downloads over long-term value. Because most users abandon apps within 30 days of installing them, a high number of downloads doesn't mean loyalty, satisfaction, or high revenue. The time/value ratio is much more important.
With YouTube, for organic, average viewing time (DVM) and click through rate (CTR) should be preferred over YouTube search optimization, descriptions, tags, and other vanity measures. YouTube highlights videos (and channels) that demonstrate significant engagement, which is exactly what the average viewing time and click through rate do.
By elevating, we mean that a high AVD and CTR can get you into YouTube's recommendation engine. In 70% In some cases, the content that users consume is recommended by the AI and YouTube algorithm, so you have to be on the ball.
Why is YouTube increasing AVD and CTR? These two measures represent a high level of commitment.
AVD is the total viewing time divided by the total number of plays of the video, which means that viewers watch longer, and sometimes even replay. A high CTR means your tagline and thumbnail resonated enough with your audience to click and watch the video.
Understanding which videos resonate and generate interest allows you to replicate the successes and optimize the ones that fall flat.
Once you've mastered your organic marketing strategy, you can bring YouTube ads into the game. With the right targeting and content, paid ads can expand your reach and revenue.
As with any marketing action, be sure to align your ads with the stages of the funnel. Choose an ad format and a campaign that matches your end goals (for example, are you looking to generate traffic or leads?)
The three most important metrics for tracking ad performance, especially when it comes to ROI, are view rate, CTR, and earnings per view. They tell you how many people actually watched your videos, clicked on them, and how much money was earned per video view.
Of course, a video with a low return on investment can still generate awareness, broaden impact, and lead to sales. At the edge, you should monitor all metrics, but prioritize those that align with your goals and generate profitable traffic.
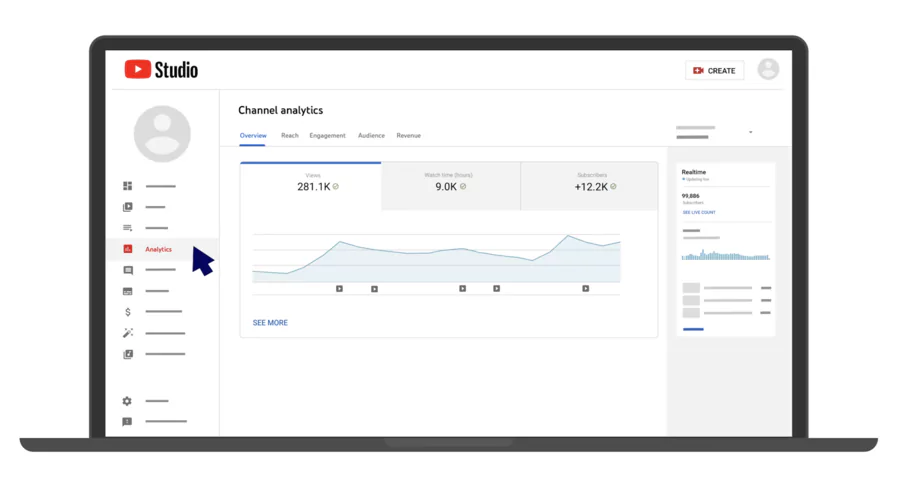
How to implement YouTube Analytics
Setting up your YouTube stats is very easy. To get started, go to your profile in the top right corner and select YouTube Studio:
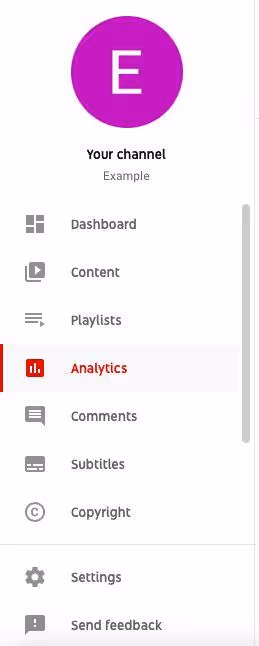
You'll see a list of icons and options on the left side of the screen, under your profile icon. Select Analytics:
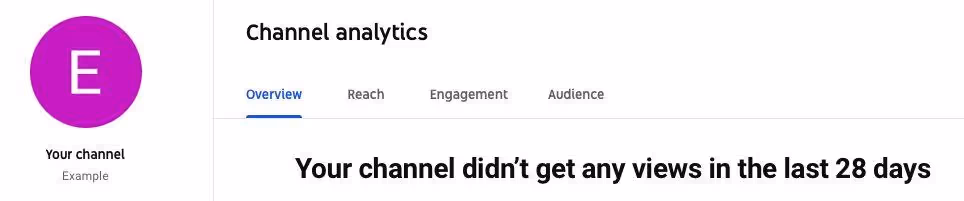
Your dashboard has four Channel Analytics tabs (five if you have the Revenue option). There you will find detailed measures concerning your account:
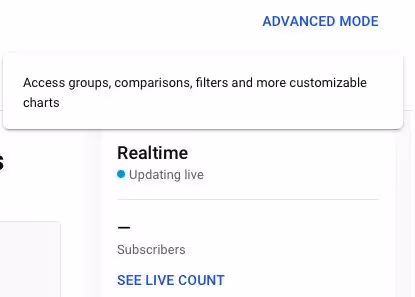
For further analysis, select advanced mode in the upper right corner. You will thus obtain individual measurements for each of your videos:
You can also connect YouTube Analytics to your Google Analytics (GA) account. This makes it possible to monitor performance directly from your GA dashboard.
In your GA dashboard, click on the Admin gear icon in the lower left corner:
Then, select Create View in the top right corner. Complete the form by selecting a view name and choosing your time zone:
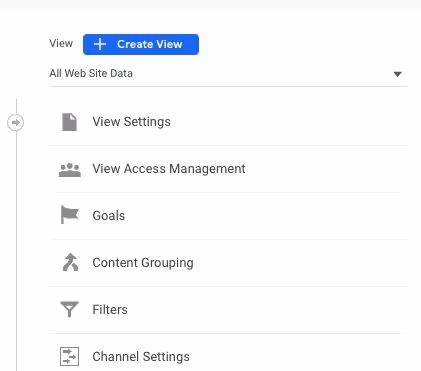
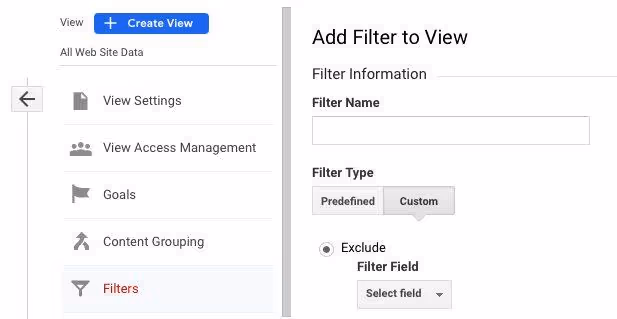
To create a filter that only shows YouTube traffic, select Filters.
Give the filter a name and select Custom:
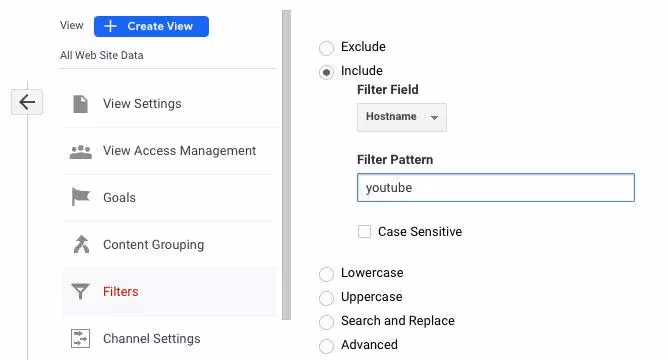
Then, click Include and choose Hostname from the dropdown menu. Type “youtube” in the “Filter Pattern” field and save:
Making the most of YouTube Analytics reports
Here are some of the top reports you can run in YouTube Analytics, and how you can use them to improve your strategy.
Overview of metrics
The Overview tab is where you'll find analytics about the overall performance of your YouTube channel, including:
- Subscribers
- Real-time views
- High-level videos
- Chain monitoring time
- Channel views
Use these metrics to identify average trends and get a quick overview of channel performance.
For example, subscribers are your most loyal fans. If your goal is to increase loyalty and engagement, pay attention to them. They are watching 2 times more videos than non-subscribers. But that's only if subscribers actually engage with your content and channel.
You want the number of subscribers and the viewing time of the subscribers to increase in tandem. That way, you can measure reach alongside engagement to see if your videos are having the desired effect.
Scope measurements
If you're creating TOFU videos, measuring reach will let you know how viewers are finding your content. Audience metrics include the following reports:
- printouts
- Impression click rate (CTR)
- Traffic sources
As noted above, most people find your content through YouTube's recommendation engine. Only 15 to 25% come from research. The rest is presented in the form of suggested videos or accessible via the navigation functions:
You should still optimize videos to be ranked by keywords, especially if raising awareness and reaching a wider audience is important. But Google gives priority to “video keywords” when it comes to ranking. Video keywords represent keywords that are already linked to videos on the platform.
Don't waste your time trying to get a “non-video” keyword to rank.
Also, focus on video keywords that score in one of the top three places on Google.
55% of all clicks come from these top-ranking keywords
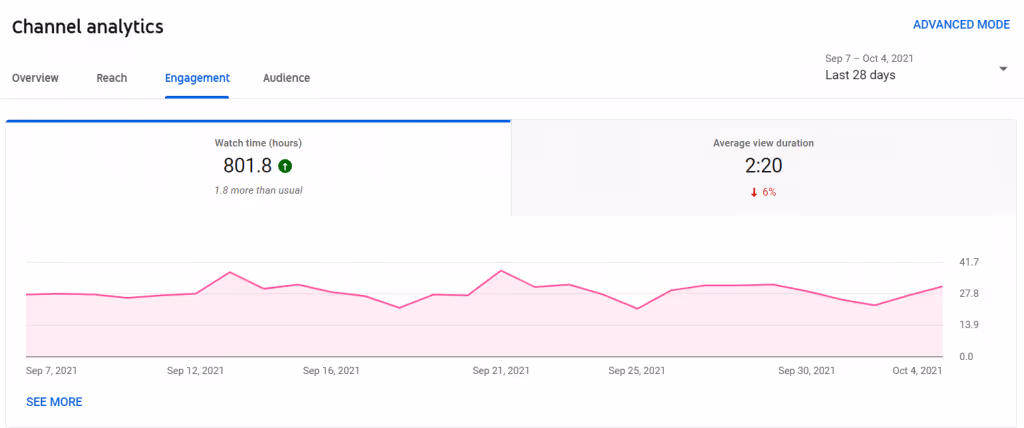
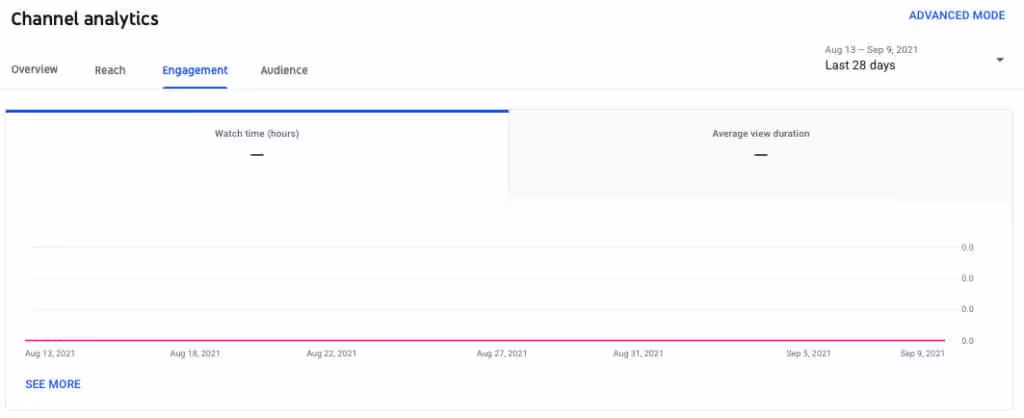
Commitment measures
For your MOFU content, focus on the Engagement Metrics tab. It gives you insight into how viewers engage with your videos, including:
- Average viewing time
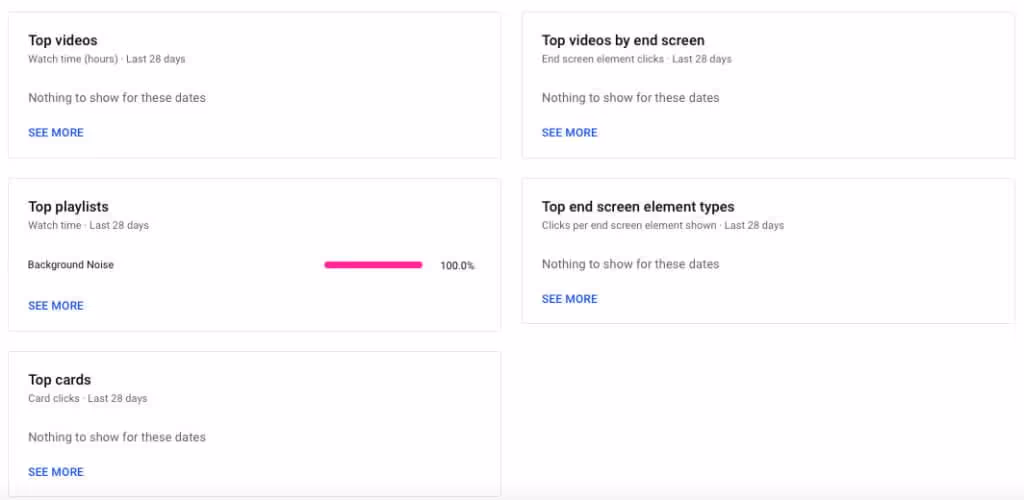
- The best playlists and maps
- Top videos and top videos by end screen
We explained why the AVD has so much weight in the recommendation engine. But what about playlists?
Good playlists encourage replays. With playlist reports, you can see how individual playlists contribute to your channel's performance. Additionally, session viewing time increases each time people watch your playlists. It's important.
Session length, like AVD, shows how much time viewers spend interacting with your content. Longer sessions lead to better engagement. YouTube loves that because it means people are spending more time on its platform.
One way to optimize session viewing time is to optimize playlists. A simple trick is to change the order of the videos. If you have a poorly performing playlist (or an old list that has lost interest), simply reorder individual videos according to their performance.
Use analytics to see which videos get the most views and put them at the top of the playlist:
By featuring the most interesting videos, you engage your audience and increase the chances of them staying put for the duration of the playlist.
Also, make sure that your playlists match your main message. Who is your channel for? What is this person trying to achieve?
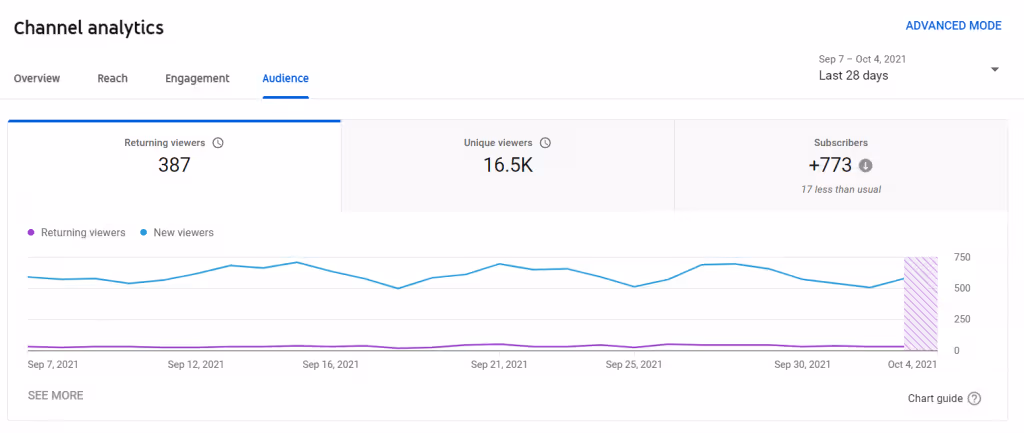
Audience measurements
The audience tab will show you who is viewing your content. Here's what you'll find:
- Unique viewers
- Viewers are back
- Subscriber standby time
- When viewers are on YouTube
- Audience demographics
- Main geographic areas
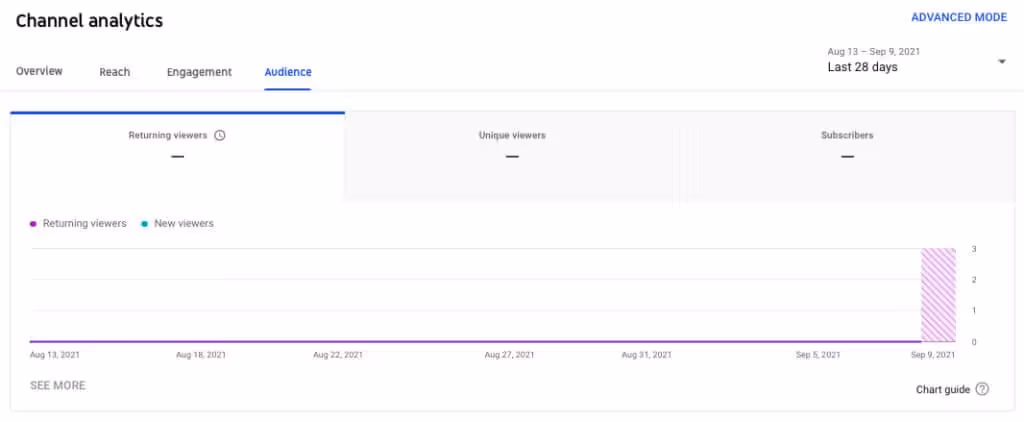
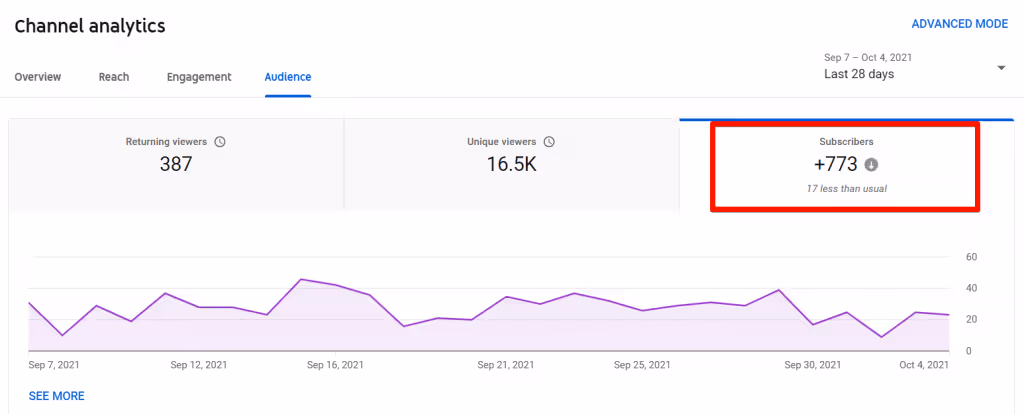
We mentioned the standby time of subscribers earlier. This measure is important because subscribers alone can be a measure of vanity.
But subscribers who engage are like rewards program members who make frequent purchases. Their intention (to subscribe, or to enroll in a program) actually corresponds to their behavior (watching videos, or making purchases to unlock rewards).
To increase subscribers, ensure you have a great value proposition Potential subscribers should understand:
- Who are you?
- Why should they care
- What makes you different
- The value they will get by subscribing
Create a compelling trailer that answers these questions right from the start. And be sure to include CTAs at the end of each video.
Income measures
This tab is not available for all YouTube Analytics users. If your account is eligible for monetization features, this tab allows you to track your earnings. To be eligible, you need to be accepted into the YouTube Partner Program (YPP).
For be able to join YPP and run ads on YouTube videos, you need to have more than 1,000 subscribers and over 4,000 hours of valid public viewing in the past 12 months.
Here are some of the reports that live on monetization:
- Estimated revenue and estimated advertising revenue
- Revenue per thousand (RPM)
- Transaction income
- Estimation of monetized playbacks
Earlier, we noted that viewing rate, CTR, and earnings per view matter above all else. You can access key YouTube Ads metrics by creating reports from your Google Ads account:

If your ads aren't effective, they'll have a low view rate, which means people are ignoring them. A low CTR means that there are not many people clicking on your ad, so there is no interest in it. Low gain per view can mean a number of things.
If you have high viewing rates and CTR but low earnings, there is clearly a barrier to buying. For example, a CTA that encourages paying money into a TOFU ad (the CTA here should be to find out more, not to pay money right away). It could also be that your landing page is faulty or contains faulty CTAs.
When it comes to the revenue you can see in YouTube Analytics, the RPM is important because it gives you an overview of ad revenue per 1,000 views. It represents revenue after YouTube took its share, so it's net revenue rather than gross revenue:
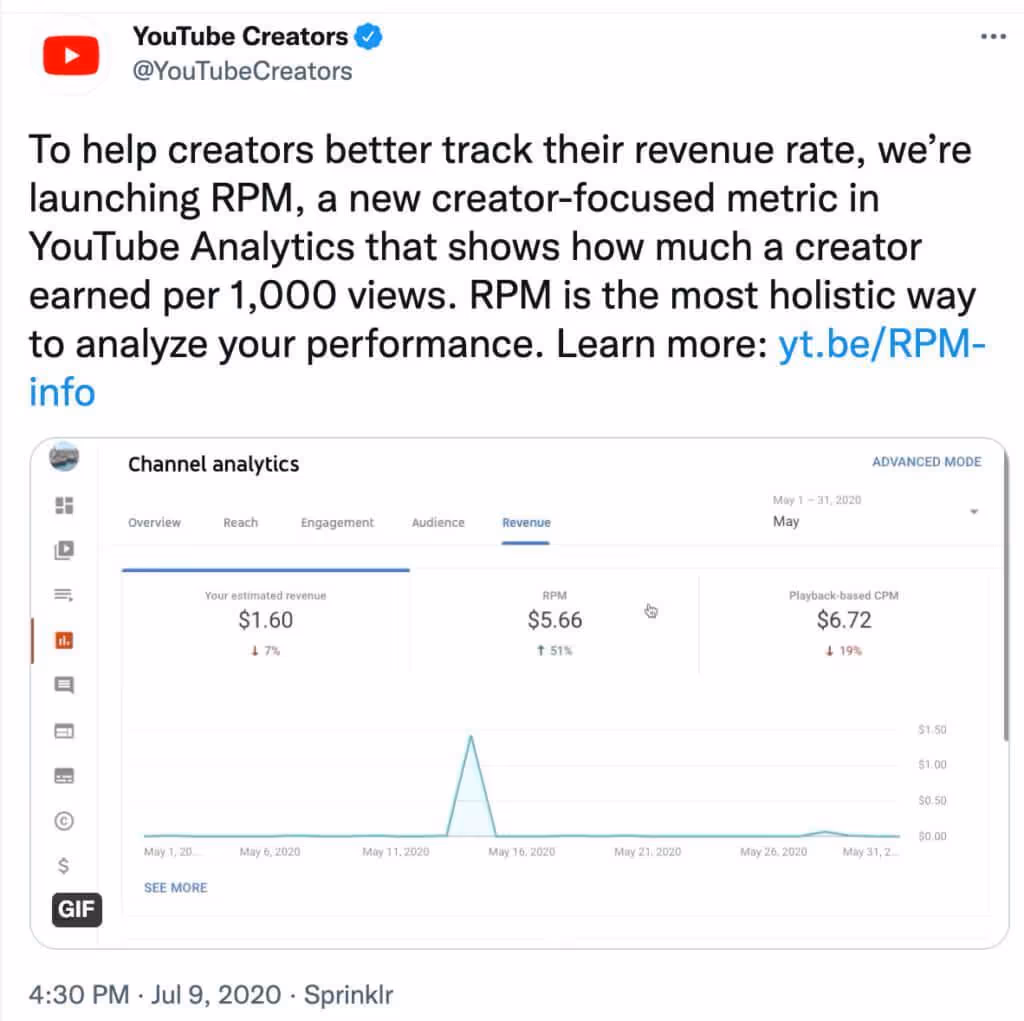
With this data, you can better contextualize the gains while measuring the videos that have the most impact.
Interaction reports
Besides simply knowing how many people are watching your videos, it's also important to understand how those viewers interact with the videos. YouTube Analytics helps you with this by providing you with interaction reports.
Subscribers
The Subscriber Report helps you understand how you're losing and gaining subscribers for different content, dates, and locations. That means you'll be able to see which videos were successful in generating subscriptions more effectively. So you can try to create more similar content to get more subscribers.
In addition to that, you can also see which videos caused you to lose the most subscribers. This will help you understand what types of content to avoid in the future. You'll also be able to identify where your content has a large number of subscribers. You can then create content that is relevant to viewers in those locations.
What you like and what you don't like
A great way to understand how your content is performing is to look at the likes and dislikes report. It allows you to discover the net change in the number of likes and dislikes that your videos receive. While it's desirable to get a high number of “likes,” there's no reason to worry if you don't get the number you want. People may be more likely to watch, share, and/or comment.
At the same time, you should be alert when your video receives an unusually high number of disapprovals. It might be a good idea to review the video that is constantly getting a lot of disapprovals and see what changes you can make.
Comments
You can use the Feedback report to see how people are commenting on your videos. It will show you how many people are commenting and which videos are getting the most comments.
If possible, try to find time to respond to these comments to show that you are listening. It's a great way to engage with your audience on a personal level.
Share
The sharing report gives you accurate information about how many times your videos have been shared. That means it doesn't just tell you how many shares have been made via the YouTube Share button. It also helps you discover the sites where people share your video, such as Facebook, Twitter, Blogger, and more.
Try to find out which of your videos are getting a lot of shares on social media. See what good you do in the video and create similar videos to get even more social shares.
Notes
The annotation report helps you understand the performance of your video annotations in terms of click rates, close rates, etc. You'll be able to see the number of times your annotation has been displayed, the number of times a clickable annotation has been displayed, the number of times a closable annotation has been displayed, the number of clicks on the annotation, and more.
Annotations are a great way to encourage your viewers to take action during or after watching your videos. Depending on how you implement them, you can significantly increase your audience and engagement rates. With the annotation report, you will have a better idea of how to integrate annotations more effectively.
For example, you may notice that the click and close rates for your clickable annotations are much higher than for non-clickable annotations. This may encourage you to implement more of these annotations for future videos.
How to optimize video content by analyzing your competitors
Comparing your content to that of competitors in your sector allows you to identify the gaps and opportunities in your strategy. You can find what's trending in your niche, what audience your competitors have, and what's successful in their videos.
You don't need additional software or expensive tools to do a competitive analysis.
Identify competitors in your industry
Find competitors on YouTube by looking for similar products, services, locations, and keywords. Make a list of a few competitors who have an active presence and a strong audience.
For example, if you own a content marketing agency, you can search for “B2B content marketing agency” or “content marketing” to see who has videos that rank:

You can also use keyword research tools, like Ahrefs and SEMrush, to complement your competitor research.
In Ahrefs, set the Keyword Explorer report to YouTube and search for “content marketing.” This will allow you to visualize the search volume and identify potential auxiliary keywords to target:
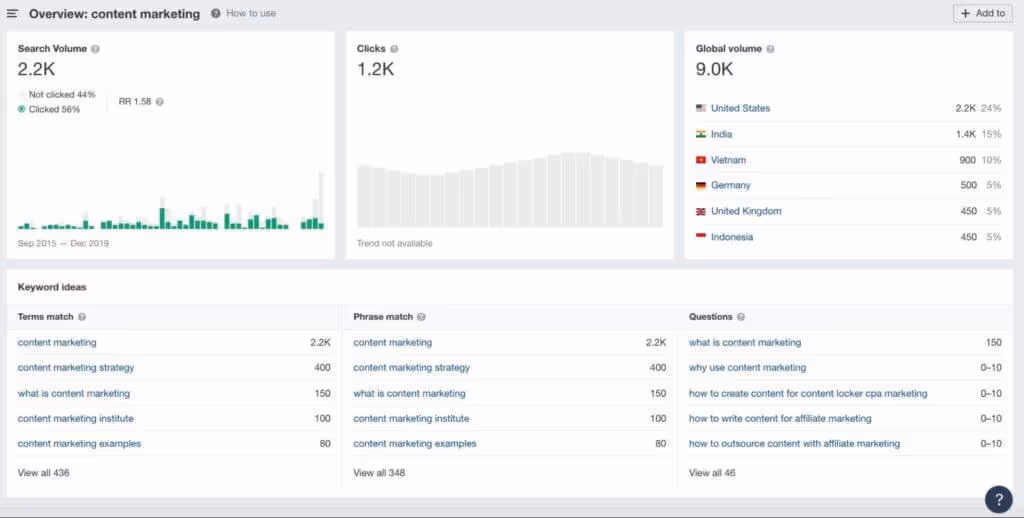
You can't use this information to find out who is currently ranking for these keywords, but you can use it to identify what content to produce next. (Remember that videos that are related to the highest ranking keywords are easier to rank for yourself.)
Review their video content
Watch competitive videos, and analyze the following points:
- What type of content has a high level of engagement?
- What type of videos are they creating?
Take the product brand Yeti: their YouTube page is designed to tell the brand story. Almost all videos tell a story, and only sometimes feature their products.
It's important to note that each video involves someone doing something in nature, and that people who spend time outside are their target audience:
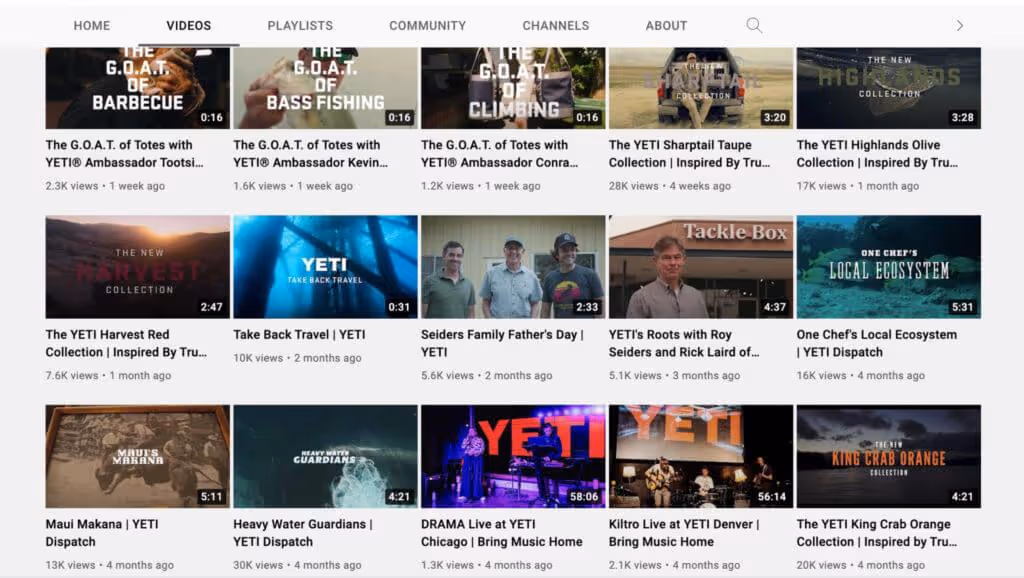
It is clear that it is working. Not only do they have a high number of views, but they have an extremely positive engagement:
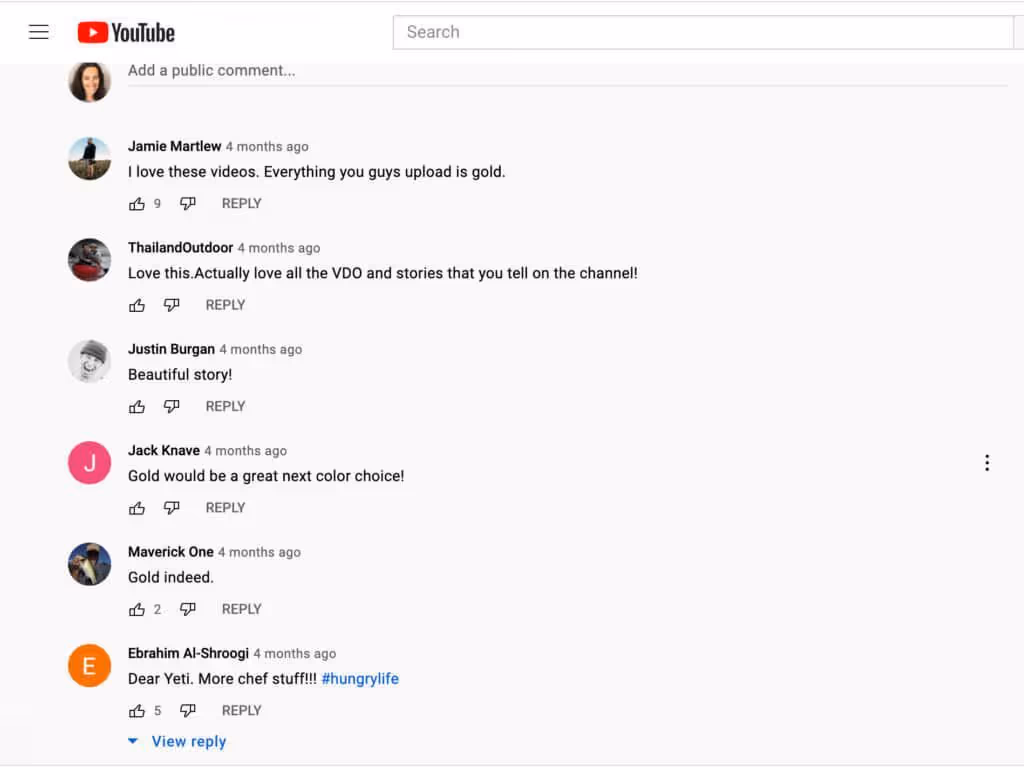
If Yeti were one of your competitors, it would be interesting to see if storytelling resonates with your audience.
Free tools like BuzzSumo can help you boost this research. You can analyze all of their content, see what's being shared the most, analyze the keywords they're ranking for, monitor content performance, and explore untapped growth opportunities (that they're ignoring).
And Tubebuddy is well known to YouTube marketers as one of the best Youtube SEO tools to get more views and subscribers. The platform is designed to help you find, publish, optimize, promote, and test content quickly. The extension includes advanced keyword research, time-saving templates and tools, and simplified A/B testing.
Conclusion
YouTube is a great platform to promote a brand, attract an audience, and generate revenue.
In itself, YouTube Analytics is a powerful tool that can be used to increase your reach and revenue. Combined with Google Analytics and other data collection tools, it allows you to focus on important metrics and identify what's working (and what can be improved).
Be sure to monitor your metrics regularly to stay on top of trends and monitor your competitors to take advantage of opportunities in your niche.