.svg)
ChartBlocks is an online software platform that allows you to quickly and easily create charts that are embeddable and shareable.
Create a chart in minutes using the easy-to-use chart designer, choosing from dozens of chart types and then customizing them to suit your needs.
Get data from almost any source and even create charts that draw data from multiple sources. The Data Import Wizard will allow you to start visualizing your data in no time.

Embed your graphics into any web page; share them using built-in social media sharing tools to send your chart directly to Facebook and Twitter.
You can also export your graphics as editable vector graphics for use in Illustrator and other graphics packages.
ChartBlocks is an online charting tool designed to simplify the visualization of complex data. Here is a detailed review of its main features:

ChartBlocks makes charting accessible to anyone, regardless of technical skill level.
The ChartBlocks user interface is particularly user-friendly, making it ideal for novices. However, experienced users might be looking for more advanced customization options.

Manage your data effectively for optimal visualization.
The ease of importing and manipulating data is an asset, but the depth of data processing features may not be enough for very complex analyses.

Easily share your graphics with a large audience.
Critical review: Sharing and integration options are a major asset, making ChartBlocks ideal for online presentations. However, the quality of the exported image may vary depending on the format.

Work as a team to create collaborative graphics.
Collaboration is simple and effective, but managing access rights could be more complex in larger team environments.
Create dashboards and reports for in-depth analysis.
Dashboards and analytics reports are useful for an overview of data, but the complexity of these features may require some familiarization.
Creating a bar chart is incredibly easy with ChartBlocks. Once you've created your account, you'll be taken to the charts screen, where you can create your first chart. Then just follow the steps below:
Click “Create Chart,” then select “bar” in the leftmost column.

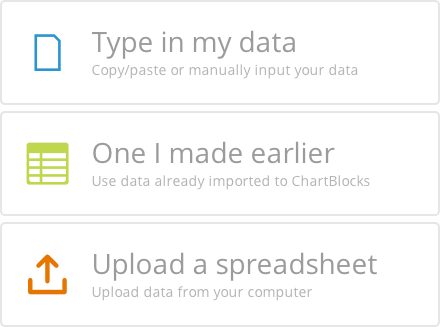
You then have three options for providing the chart data. You can select a new/neutral data set, where you can enter your data manually or copy and paste it into. The second option is to use an existing data set, which you have already uploaded for other carts. The final option is to import data from your computer in the form of a spreadsheet.
Once you have provided the data for the chart, you select the data column that will be used for the X axis of the chart. You then select the column or columns that will be used for the bars in the chart.

The next step is selecting a template for the chart and deciding what you want to do with it.

You can save and download it, as well as share it on social media and embed it into your WordPress website or blog. Once the chart is complete, you have complete freedom to edit it as you see fit. You can change all parts of the chart, including data, axes, metadata, and even the chart type.

By default, the assistant shows a column chart, if you want to change it to horizontal, use the type option in the side menu and change it to a horizontal bar, as you can see below.

What type of data is a bar chart useful for?
If you want to graph data but are not sure if a bar chart is the best option, it's helpful to know what type of data it's appropriate for. Bar charts are great when you want to show data in a way that's extremely easy to read, such as what kind of movie people in different age groups prefer.
Domo is a BI platform focused on connectivity and collaboration, offering integrated solutions for real-time data visualization and analysis, tailored to businesses of all sizes.
Domo is a comprehensive ChartBlocks alternative, offering advanced BI and data visualization capabilities for businesses looking to integrate and analyze information in real time.
Sisense focuses on offering BI tools for visualizing complex data, allowing users to create interactive dashboards and in-depth analyses without requiring advanced technical skills.
Sisense is a powerful option for businesses looking to exploit BI for complex data analysis, offering a user-friendly approach to data visualization and analysis.
QlikView is a BI solution that is distinguished by its in-memory association technology, allowing rapid and intuitive exploration of data for informed decision-making.
QlikView is a beneficial ChartBlocks alternative for businesses that want a flexible and powerful BI solution that can manage a wide variety of data sources.
These options, Domo, Sisense, and QlikView, offer diverse alternatives to ChartBlocks, each with their unique strengths in BI and data visualization. Do these suggestions meet your expectations? Are there any other specific tools or features you want to explore?
ChartBlocks provides its users with several options for obtaining help and support in using the tool.

First, comprehensive guides are available directly in the interface in the form of video and written tutorials. They cover all features:
An FAQ also lists frequently asked questions and provides detailed answers to common problems encountered by users.
For more specific support requests, ChartBlocks offers a direct contact form from the interface. The support team can be reached from Monday to Friday to provide personalized assistance by email or phone if necessary.
Finally, for advanced requests such as API integration or the development of custom functionalities, technical teams can also be contacted using a dedicated form.
With these different support options, ChartBlocks guarantees optimal support to its users to take full advantage of its data visualization tool.
ChartBlocks supports these languages: English.
ChartBlocks offers support via 24/7 live support.
ChartBlocks integrates with: Bit.ai and Turtl.
ChartBlocks is an online charting platform, designed to allow users to easily build custom charts and diagrams.
Launched to offer an accessible data visualization solution, ChartBlocks stands out for its ease of use and its ability to import data from a variety of sources.
ChartBlocks is ideal for marketers, analysts, educators, and anyone who needs to quickly create custom charts for presenting data.