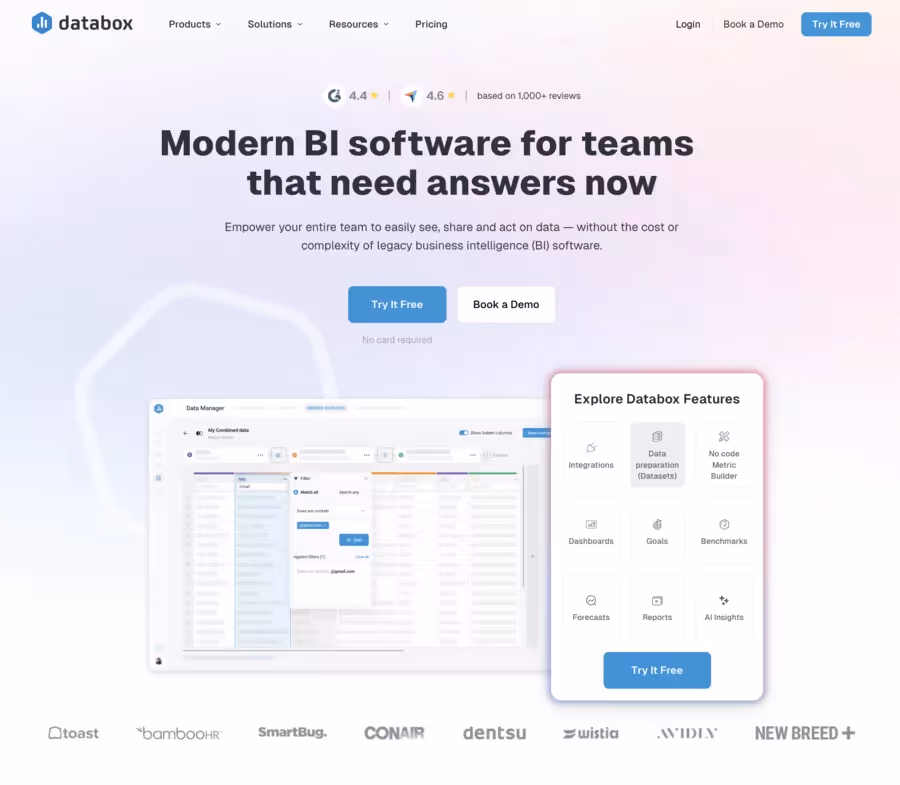
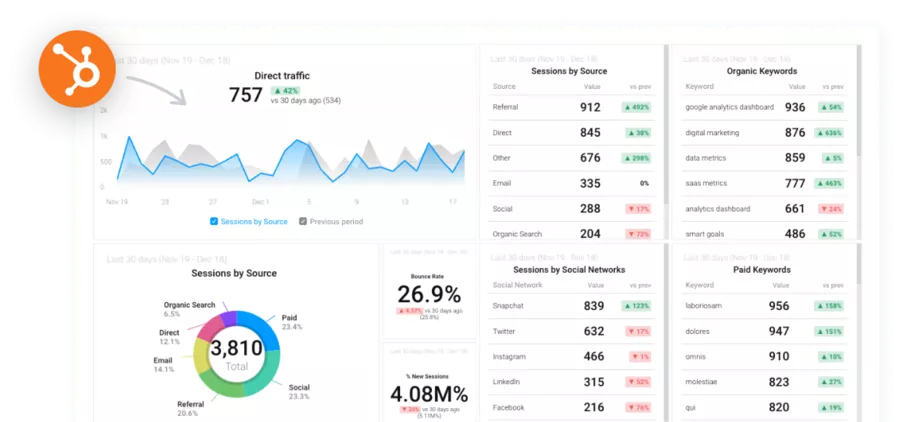
Databox is a modern Business Intelligence (BI) software solution designed to simplify data collection, analysis, and visualization to help businesses make fast, informed decisions.
Designed for professionals, marketing managers, analysts, SMB leaders, and IT teams, Databox centralizes all important data in a single space accessible to all relevant stakeholders, with quick and intuitive onboarding.
What is Databox?
Databox is a cloud-based self-service business intelligence software used by over 20,000 companies and agencies.
This software eliminates the complexity of traditional BI solutions with easy setup and low cost.
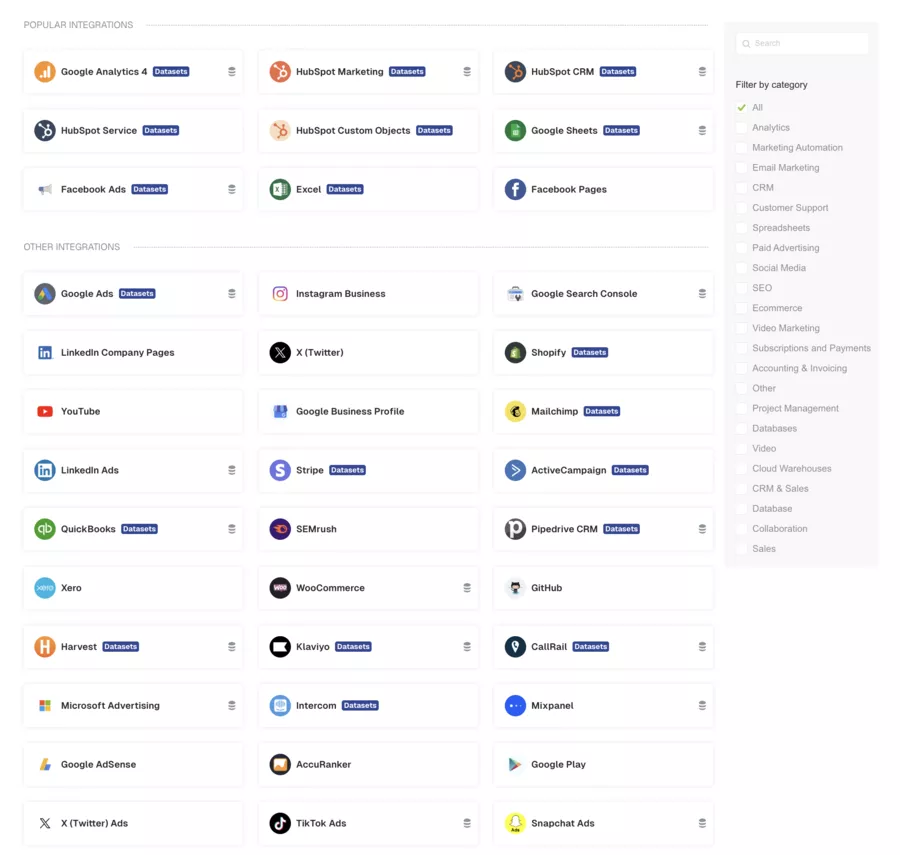
It connects over 130 data sources (marketing tools, CRM, databases, spreadsheets), providing a unified, interactive view of KPIs in real time.
Its goal is to make data accessible without requiring advanced technical skills, thanks to a drag-and-drop editor, a no-code SQL builder, and advanced automation and artificial intelligence features.
Databox Alternatives
Here's a clear comparison table of the main alternatives to Databox for web and marketing performance analysis and reporting:
🛠️ Solution
🔥 Features
🔒 Security & Privacy
💸 Pricing
🌐 Ideal Use Case
Databox
No-code centralization 🎯, custom dashboards, 70+ integrations, team collaboration
Client access management, advanced privacy, secure transfer
From $59/month for 5 clients
Agencies, multi-data client reporting
Geckoboard
Real-time KPIs 🚀, TV dashboards, ultra-fast setup
Secure export, user lists, access control
From $49/month
Quick visual tracking, collective screen display
DashThis
Automated reports 📝, marketing integrations, link sharing
Secure storage, privacy via settings
From $49/month
Freelancers/SMBs, automated periodic reports
Tableau
Advanced analytics, large datasets, market reference
Enterprise security, user management, cloud or local installation
From $70/month per user
Advanced analytics, large enterprises, custom methods
Improvado
ETL automation, source control, AI intelligence 🧠
GDPR compliance, multi-domain management
Custom quote based on workload and needs
Large data teams, strong information centralization
Main Uses of Databox
Databox is primarily for businesses and teams looking to:
Track their business and marketing activities' performance in real time.
Databox helps growing businesses optimize their data usage.
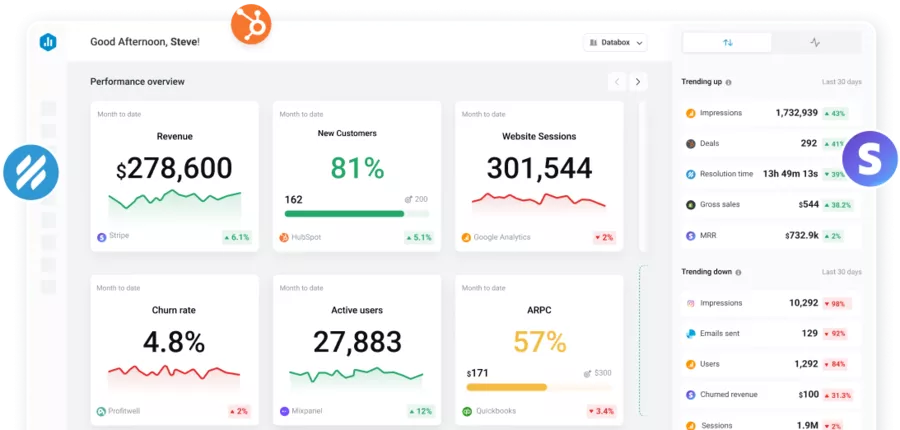
Create custom, interactive dashboards to easily visualize KPIs.
Automate reports and quickly share data with teams.
Improve decision-making based on consolidated, reliable data.
Databox helps growing businesses optimize their data usage.
Key Features of Databox
📊 Main Databox Functions and Benefits (2026)
🚀 Feature
💡 Description
🎯 Main Advantage
Multi-source data connection
Connects over 130 sources (Google Analytics, HubSpot, Salesforce, Meta Ads, etc.)
Centralizes all data in a single interactive dashboard
No-code SQL builder
Visual interface for creating SQL queries without coding
Allows non-technical users to freely explore and filter their data
Customizable dashboards
Visual report creation with drag-and-drop, interactive charts, and dynamic filters
Provides clear, intuitive visualization on desktop or mobile
Automatic insights & forecasts
Built-in AI to detect anomalies and predict key trends
Automatically alerts on at-risk or growing KPIs
Centralized data management
Data cleaning, merging, and harmonization across different platforms
Ensures reliability and consistency of shared analyses
Real-time performance tracking
Automatic KPI updates with alerts via Slack, email, or mobile
Facilitates quick decisions and operational responsiveness
Multi-user collaboration
Access management, integrated comments, and team notifications
Strengthens transparency and team alignment around common goals
Mobile & cross-platform
Responsive application on browser, iOS, and Android
Performance monitoring and tracking on the go
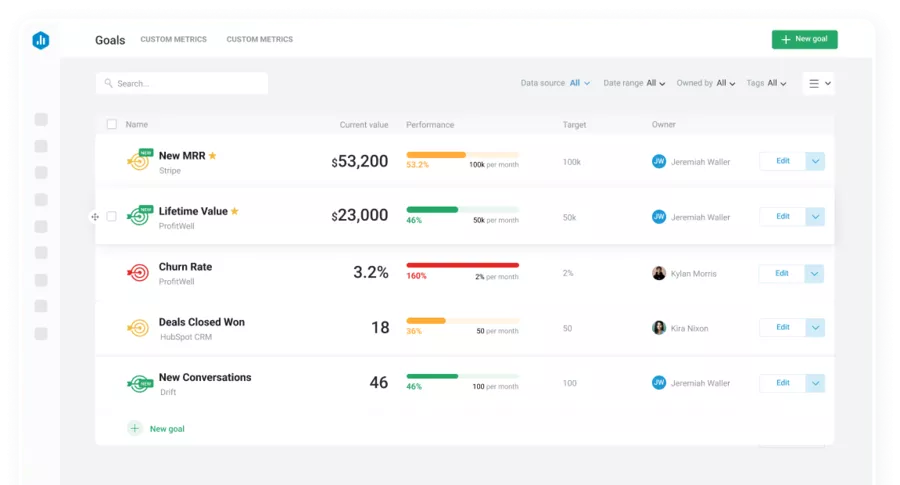
Data Alerts & Goals Tracking
Custom alerts and progress tracking toward set goals
Encourages a culture of continuous, measurable performance
Who is Databox For?
Databox enables teams to make better decisions faster:
Marketing, sales, and finance managers who want a clear view of their performance.
Data analysts seeking a powerful yet easy-to-use BI tool.
SMB leaders wanting to manage their business with real-time indicators.
IT and operations teams that need to consolidate data without requiring complex technical expertise.
Databox's Key Differentiators
💡 Databox Key Differentiators (2026)
💡 Advantage
📋 Description
🚀 Concrete Impact
Ease of use
Intuitive interface with drag-and-drop and no-code SQL builder. Almost no training needed for new users.
Fast adoption, immediate productivity, and reduced training costs.
Advanced automation
Scheduled reports, smart alerts, and integrated AI recommendations.
Significant time savings and improved responsiveness to performance changes.
Extensive connectivity
Over 130 native integrations (HubSpot, Google Analytics, Meta Ads, Salesforce, MySQL, etc.) and open API.
Unified view across all data, eliminates silos between teams and tools.
Reliability & technical support
Uptime rate over 99.9%, responsive support (chat, email, clear documentation).
Data always synchronized, increased confidence in reports and alerts.
Integrated collaboration
Unlimited users, custom roles, integrated comments, and project-shared dashboards.
Smooth communication and strengthened coordination within marketing, sales, or management teams.
Mobile accessibility
iOS and Android applications with optimized visualizations and real-time notifications.
KPI tracking on the go and instant decisions from anywhere.
AI predictive analytics
Machine learning use to anticipate performance trends.
Identifies risks or opportunities before they become critical.
Design & user experience
Modern, customizable dashboards, adapted to all screens (desktop, tablet, mobile).
Smooth reading, enhanced visual understanding, and better adoption by leaders.
Integration with Other Tools
One of Databox's great strengths lies in its ability to integrate seamlessly with a multitude of tools and platforms used daily by businesses. Through these integrations, it becomes possible to centralize all your data from different services – whether project management tools, marketing platforms, e-commerce solutions, or specialized web applications.
🔗 Databox Integrations — Compatible Tools and Practical Uses (2026)
🌐 Category
🔧 Integrated Tools Examples
🎯 Objective / Benefit
Web analytics & SEO
Google Analytics 4, Google Search Console, SEMrush, Ahrefs, SE Ranking
Track organic traffic, SEO performance, and conversions in real time
CRM & sales
HubSpot, Salesforce, Pipedrive, Zoho CRM
Centralize leads, track conversion rates, and measure sales performance
Digital advertising
Google Ads, Meta Ads, LinkedIn Ads, TikTok Ads
Analyze acquisition costs, ROAS, and cross-channel performance
Evaluate engagement, reach, and social campaign trends
Data & cloud storage
Google Sheets, BigQuery, Snowflake, MySQL, PostgreSQL
Import, merge, and leverage raw data without duplication
Automation & no-code
Zapier, Make (ex-Integromat), n8n, Airtable
Create automated flows between Databox and other applications without coding
e-Commerce
Shopify, WooCommerce, Stripe, PayPal
Track sales, average cart value, and product performance
Communication & collaboration
Slack, Microsoft Teams, Google Chat, Email Reports
Receive alerts and automatic reports for smooth coordination
Productivity & project management
Asana, ClickUp, Monday.com, Trello
Visualize project progress and team performance
Security & compliance
SSO (Okta, Azure AD), audit trail, roles and permissions management
Ensure confidentiality, traceability, and GDPR compliance
In summary, Databox's integration with other tools and platforms allows you to manage your business in a centralized, secure, and efficient manner.
Conclusion
Databox BI software is a powerful and accessible solution for any business looking to fully leverage their data without the complexity of traditional tools. Its self-service approach, intuitive interface, and advanced automation and artificial intelligence features facilitate quick creation of interactive dashboards and real-time KPI tracking.
It allows all teams to align around a single source of truth, thus boosting performance and data-driven decision-making.
For professionals or leaders looking for a simple, comprehensive, and scalable BI tool, Databox is a relevant choice that combines efficiency, flexibility, and ease of use.
For pricing, Databox offers 1 free plan and 4 paid plans. The price varies depending on the number of users and the volume of data dashboards. The approach is designed to scale progressively: start light, add sources, standardize your report features, then extend sharing to all teams.
Actionable tips:
Start with the free plan to validate 1–2 use cases; if demand grows, migrate to a paid plan.
Structure your analytics domains (marketing, sales, product) with distinct templates.
Define access settings (who sees what) to avoid any privacy issues.
Standardize a strong password and associated security rules for the reporting portal.
💳 Databox Plans – Pricing and key features (2026)
🧩 Plan
👥 Target
🔑 Key Inclusions
📈 Scalability
💵 Monthly Price
Free ✅
Freelancers, POC, startups
3 dashboards, 3 data sources, daily refresh, limited sharing
Low → Medium
$0
Starter 💡
Small businesses and marketing teams
10 dashboards, 10 connectors, automatic reports, dynamic alerts and goals
Medium → High
≈ $47/month (billed annually)
Professional 🚀
SMBs, digital agencies
Up to 50 dashboards, unlimited user access, custom API, Slack & HubSpot integration
AI automations, multi-channel attribution, premium SLA, dedicated support, and reinforced governance
Very High
Custom quote (starting from $500/month)
Databox Technical Support - Installation & Configuration
To install and configure Databox without friction, follow this 3-step journey. The goal: an operational dashboard, reliable settings (sources, privacy, security), and a sharing portal ready for web and mobile devices.
1. Guided Start (Self-Assisted)
Installation checklist: create the site/workspace, invite the team, define roles and rights.
Source connection: choose your integrations (CRM, analytics, Ads), authorize secure transfer, test KPI measurement.
Ready-to-use templates: select a template per domain (marketing, sales), adapt widgets, validate automatic updates.
Advanced support: assistance with multi-account configuration, information standardization, custom connectors.
🛠️ Databox Support Channels — when and how to use them (2026)
📞 Channel
🎯 Use for
✅ Deliverables / Benefits
Knowledge base 📚
First installation, initial configuration, dashboard templates, source connection
Detailed tutorials, illustrated guides, autonomous resolution of frequent issues
Online messaging 💬
Configuration blocks, API integration errors, real-time assistance on settings
Responsive support, personalized diagnosis, sending resources or direct links to the right sections
Email / Ticket 📨
Data synchronization issues, technical incidents, security or privacy-related questions
Traced exchange tracking, priority treatment, recommendations and associated documentation
Accompanied onboarding 🤝
Team or multi-domain deployment, governance setup, advanced configuration
Personalized sessions, custom action plan, KPI checklist and access matrix by role
Training & Webinars 🎓
Skills development on dashboard usage and AI automations
Interactive sessions, practical cases, internal Databox Academy certification
Best Practices (Essential)
One KPI = one verified source: document the reference (definition, period, filter) to avoid any discrepancy.
Roles & rights: limit editing, favor sharing in read-only mode to clients/partners.
Security & cookies: align collection with your internal policies (data age, retention, privacy).
Pre-release testing: check rendering on all devices (desktop/TV/mobile) and on your external portal.
Escalation: if request is complex (numerous sources, high demand), switch to accompanied onboarding.
ℹ️ Hours, SLAs, and support formats may vary by plan. To choose the right level, evaluate: number of sources, number of users, criticality of datasets, update frequency, and security requirements.
Conclusion & Critical Review
What Databox does very well: information centralization and real-time measurement reduce team workload and stimulate collaboration. Databox offers future performance forecasts for each indicator. No-code templates and web integrations accelerate installation and configuration, while the portal and sharing simplify distribution to clients and partners.
Databox helps set realistic goals based on historical data.
Points of attention: price can increase with the number of users and data dashboards; plan security, privacy rules, and fine-grained settings control to avoid any governance issues.
Recommendation: start with a core set of indicators, check data age and update rhythm, then expand by domains (marketing, sales, product). Use templates to standardize reports and document each KPI reference.
FAQ
Does Databox handle cookies and privacy?
Yes, through settings and security policies; you control what information is displayed and to whom.
Can you connect multiple domains and partners?
Yes. Multi-source configuration relies on a list of native integrations and transfer/export options.
What is the impact on workload and KPI updates?
Centralization reduces manual workload; KPIs update automatically according to the source.
Are mobile devices and video display supported?
Yes. Databox offers a responsive portal and TV/board display for the site or office.
How do prices evolve?
There is 1 free and 4 paid plans; price depends on required users and data dashboards.
Can I apply my internal control methods?
Yes. Roles, rights, view command, and global settings allow precise framing.
Is Databox suitable for gaming teams or other internet sectors?
Yes. Generic features (templates, alerts, transfer) adapt to clients in any domain, including gaming.
TRANSPARENCY ON PARTNERSHIPS We carefully choose the software, platforms, and services we recommend based on their quality and reliability. Our team tests and approves them, regardless of any business agreements.If you make a purchase or sign up through our partner links, we may earn a commission. This doesn’t cost you extra and helps keep our content free.
PhantomBuster: launch your first LinkedIn campaign without the busywork
Build a targeted prospect list, enrich profiles, and organize follow-ups in one workflow. Spend less time moving data and more time personalizing your message.
14 days free. No credit card or automatic charge. Includes 2 execution hours and 5 automation slots.
Set your targeting and daily limits, run one Phantom, and export a prospect list ready to work.
.svg)


-2-2.avif)