.svg)
Hotjar, introduced in 2014, is a behavioral analysis tool focused on collection of qualitative information on actions Visitors to a website. More than 900,000 organizations in 180 countries use it, including marketing teams, interface designers, and managers of websites who want to improve the user experience.

While Google Analytics focuses on numbers, Hotjar focuses on qualitative aspects. It offers a concrete representation of user interactions with a site, making it possible to identify strengths and areas for improvement.
Hotjar offers four main functions:

By presenting clear and visual qualitative information, Hotjar enhances the use of tools like Google Analytics. It brings a more personal aspect to data analysis, offering directly applicable information to improve the user experience.
This method allows businesses to obtain both a numerical overview and detailed information on user behavior, which is essential for a comprehensive approach to improving websites.
If Hotjar managed to make a name for itself so quickly, it is in part thanks to additional features that he proposes. The 4 most useful are:
Do you not understand why the users of your site are not taking action on your site? Do you want to know which part of a page is visited the most?
La heat map or “heatmap” highlights the hot spots on your site, the ones that your visitors focus their attention on.
This feature is very practical because it allows you to know which areas of a site are of interest to the visitor and which are not. Hotjar offers 3 types of Heatmaps :

This feature is the best known and probably the most interesting of the tool because it allows you to Know what catches the eye and What works (and it's not necessarily the elements you focused on at the beginning that work best...).
It therefore allows you to reorganize and optimize your page for greater readability and appeal, for example by moving a paragraph or a call to action button so that users stay on your site and click.

Similar to Google Analytics, this feature allows you to identify the type of device with which visitors connect to your site and to analyze their behavior on each type of device (mobile, pc, tablet, etc...). So you can see which marketing channels work best and adapt your strategy and your interface accordingly.
Are you having trouble understanding the numbers provided by the analysis tools? Do you want to put yourself in the shoes of the Internet user?
This ultra-innovative feature allows you to Watch the movie of each session that took place on your site. You will be able to follow the user's navigation on the page second by second (mouse path, stop, clicks, etc...) in order to understand their journey as if you were in their place.
You can then better understand what exactly he was looking for when he came to your site.
Do you want to know what your customers think? What do they like? Why not ask them directly? Trying to understand what a visitor is looking for by analyzing their behavior is good, but asking them directly is better!
And Hotjar understood that. That is why it offers you a function of Feedback and a function of polls and surveys that allow you to ask your visitors directly to give their opinion:
This way, you will know exactly what visitors think of your site and your analysis will no longer be based solely on assumptions. The best way to find out what a customer is looking for is to ask them directly.
Hotjar is therefore a very interesting solution that fulfills two main objectives:
Now, let's talk about the platform's plans and pricing. Here are Hotjar's pricing for each plan:
Hotjar's free plan is only suitable for personal projects and websites with low traffic. The plus plan won't meet the needs of all businesses either, as it only allows up to 100 sessions per day to be captured.
The business plan is much more expensive than the plus plan. The price differs depending on how many sessions you choose to record daily. The price ranges from 79 to 289 dollars per month. As for the scale plan, which is for large businesses and websites, it ranges from $389 to $1,889 per month.

Keep in mind that if you want to use Hotjar's services for multiple websites, you need to buy a separate plan for each of them.
Hotjar and Google Analytics are two essential tools for web analysis, each bringing a unique perspective. While Google Analytics focuses on quantitative data of the traffic, Hotjar is examining the user behaviors via recordings and heatmaps. Many businesses use them in tandem for comprehensive analysis.
Google Analytics shines in collecting quantitative metrics. It tracks over 200 indicators, including page views and sessions. With the introduction of Google Analytics 4 (GA4), the monitoring of events has improved considerably.
Hotjar, on the other hand, specializes in qualitative data. It offers:
Hotjar's free plan is limited to 10,000 page views per day, which may be suitable for smaller websites.
Google Analytics offers detailed tabular reports and charts, allowing users to create customizable dashboards.
Hotjar goes further in behavioral visualization with:
Google Analytics excels at analyzing browsing flows and specific events. Sa advanced segmentation allows detailed analysis of user groups.
Hotjar, on the other hand, offers direct analysis via:
This approach allows for a deeper understanding of users' motivations and frustrations.
Google Analytics integrates naturally with the Google ecosystem and has a robust API for custom integrations. This makes it an extremely flexible tool for custom analyses.
Hotjar integrates with popular platforms like WordPress and Shopify. Although its API is more limited, it effectively focuses on collecting behavioral data.
Google Analytics offers GA4 for free, which is suitable for most businesses. For large organizations requiring more advanced analytics, Google Analytics 360 is available at around $150,000/year.
Hotjar offers a free plan with limited features. Its paid plans start at $39/month and can go up to $389/month, depending on volume and functionality needs.
By combining Google Analytics for a thorough quantitative analysis and Hotjar for qualitative and visual insights, businesses can get a complete understanding of their web performance. This approach effectively combines data on the “what” (traffic, conversions) with the “why” (user behavior), allowing for targeted and effective optimizations.
In this tutorial, we will only see how to install Hotjar, for a detailed explanation of each feature and possibility, see the Hotjar documentation, or check out the how-to guides directly for heatmaps, recordings, incoming comments, or surveys.
To install the Hotjar tracking code, you must first subscribing, then go to the Sites and Organizations page, where you will see the status of your tracking “Not installed”, click “Install tracking code.”

As the Hotjar tracking code is already installed, we see “Collecting Data” and “View tracking code” instead.
You now have 3 options.

Choose your installation method
To install it manually, choose the first option, copy the code, and paste it into <head>your website tag.
If you are using WordPress, Wix, Clickfunnels, Shopify, Webflow, HubSpot, or any other platform that Hotjar integrates with, you can follow the installation guide for each platform after clicking on the second option.
It's always best to add all of your scripts and tags using Google Tag Manager.
You can use this data to find out if your website users are scrolling to the most important section or not, if they see your calls to action or not.
If yes, that's fine, if not, you can try to replace the sections, remove the sections where they start to stop, or add additional information that makes them scroll through the pages.
You can use click map data to find out if your CTAs are getting the most clicks and if there are items that aren't clickable but still get clicks.

If your CTAs get enough clicks, that's fine; if not, you can try to make them bigger, change their color, or remove the clutter around them to highlight them.
If users click on non-clickable items, you can use them by adding links to those items, or if that doesn't make sense, you can change the style so it's not clickable.
You can use travel map data to make sure people move their mouse to areas where there is useful or important content. This actually means that people
read/watch this.

If there is less movement to the content areas, you may need to change the style of the page to highlight the content areas more prominently or redesign the section entirely.
The feedback tool is a widget that you add to your website to encourage your users to give feedback on their experience using the site.

Hotjar widget for incoming comments
By clicking on the feedback icon, your users will open the feedback widget and be able to rate their experience within a range of “hating” to “liking.” Once a user has chosen their feeling, they are asked to leave a review about their experience, along with an option to take a screenshot of a specific item or section of the web page that may have prompted them to leave a comment.
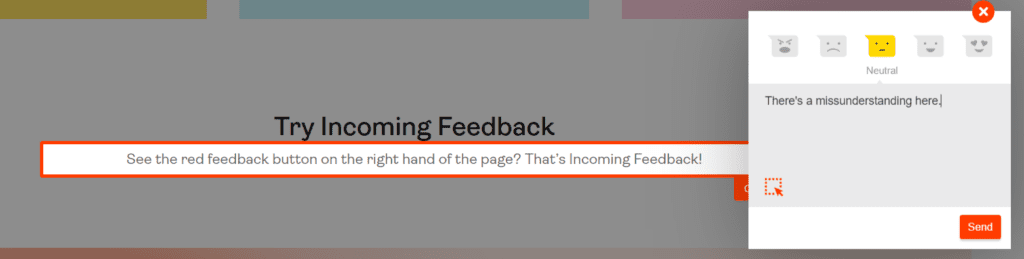
Finally, users will be able to enter their email address in case they want to receive a response from you.
With incoming feedback data, you can sort pages by their score and start optimizing the underperforming ones first. You can also look at the session recordings of users who left negative comments to see what went wrong and start fixing it.
In this way, you eliminate all the problems that you did not know about and that are blocking your growth.
Hotjar surveys are, as the name suggests, surveys that you can show to your website users in order to ask them questions and gather information and ideas directly from them to understand their needs and expectations, validate your plans, and generate new ideas and suggestions.

Hotjar survey example in the bottom right corner of our website
You can use Hotjar Surveys to ask your users:
Surveys should be your compass for moving your business forward, to use the voice of your customers in all your decisions and to build a user-centric brand.
We did some research and created a list of the most common questions we found on Google about Hotjar. We have answered all of these questions for you.
Your site and its data are safe with Hotjar. They take numerous measures such as end-to-end encryption, SSL technology, etc. to ensure the security of your data and the privacy of your users.
Some specific users may not be tracked. However, Hotjar should capture the majority of them in heatmaps and recordings.
Hotjar is a software that improves your marketing strategy and, thanks to numerous functionalities, helps you understand user behavior on your site to adapt the UX accordingly and improve the conversion rate.
With Hotjar, you no longer have to interpret numbers, you clearly understand your users.


-2-2.avif)