.svg)
GTmetrix is the performance assessment tool most used by web developers. Its easy to use interface is aimed at beginners as well as seasoned professionals.
Developed by the Canadian company GT.net, it has become one of the most reliable sources when it comes to testing the loading speed of a website or the improvements that can be made to it, earning it a place of choice in today's digital market.
GTmetrix is a trusted resource around the world, as evidenced by its use by prestigious companies like BMW and Bayer Pharmaceuticals or more consumer-focused companies like T-Mobile and Nordstrom.
The GTmetrix score is a weighted score that is derived from the results of the new performance and structure scores, which replace the old PageSpeed and YSlow scores from the old reports.

The GTmetrix grade is a weighted average of the two new percentage-based scores:
The GTmetrix score is based on a very simple formula that currently assigns a weight of 70/30 for performance and structure scores, respectively.
Keep in mind that while this is the current configuration of the GTmetrix note, GTmetrix is constantly changing and updating its formulas, and these will change over time. It was only since November 2020 that they started using this new method.
The performance score tells you how your page is performing from a user perspective.

When you do the math, the performance score is that of your lighthouse as captured by the GTmetrix tests, using its browser, hardware and software code, and any options you specified, such as AdBlock, connection speeds, etc.)
Let's see how the performance score is broken down:
The performance score is composed of 6 key metrics with the following weights:
Charging performance, which accounts for 55% of this portion of the score. This score is broken down as follows:
Each of these parameters is measured + calculated as a score, then compared to a threshold, and the overall result, with appropriate weighting, constitutes the final Performance Score. The performance score results are available on the Performance tab of the GTmetrix report.

Even though PageSpeed Insights and web.dev from Google are driven by Lighthouse, they use their own hardware and test methodologies to create your performance score. There are a few key differences that make Google's tool score different from GTmetrix's, including:
The scores generated by Google tools and the GTmetrix Performance Score should be similar, but they will not be directly comparable. It is important to understand the reasons for this.
Additionally, Google tools, PageSpeed Insights, and web.dev use Lantern, which results in significantly different page load behaviors, resulting in different performance scores and test results.
The structure score is an exclusive evaluation of Lighthouse opportunity and diagnostic audits, to be precise. The GTmetrix team took the web.dev audits and awarded them points based on numerous factors, including potential savings and importance, as perceived by their team. Just like the PageSpeed and YSlow scores in Legacy reports, your structure score reflects how well your site is built and optimized.
The GTmetrix team has also included some of their own audits that they believe are important for the performance of sites and web applications.
Full structure score details are listed on the Structure tab of the report GTmetrix :
Now, you might be wondering if my structure notes are affecting my performance ratings.
No But improving your Structure Scores can generally improve the performance of the page/site you tested as a whole. This, in the end, results in better performance scores and, by extension, in a better GTmetrix score.
You should think of individual structure audits as ingredients in the recipe for creating a quality, responsive, and successful website.
Google established Web Vitals as the basic metrics you should focus on when trying to provide a fast experience on a website or web application.

Web Vital settings are as follows:
If you're scoring well in these areas, it means you're giving your visitors a fast and enjoyable experience, as Google says.
GTmetrix offers its service in two forms, free accounts and premium accounts. The main differences between paid accounts are that you have access to premium test locations and you can run more tests per week.
With an account GTmetrix free, you have access to the servers in the following free test locations:
With a paid account, you have access to the locations above, but also to the premium servers listed below:
If your website is attracting a lot of interest in a specific region, a premium account can be very useful for more local testing.
For this article, we will be using a free account. First, let's see how to customize our test:

When you run your test, you can set up a variety of options, many of which are very useful, by clicking on the Analysis Options drop-down menu.

Let's break down these options, because there are a lot of them.
Now that we've covered the settings, let's run our test! I'm going to test from San Antonio, TX because that city is pretty close to the server location where we host our test site.

Now that our text has been run, let's look at the results!
RECOMMENDED READING: Best YouTube ad blockers for Android, IOS, and Web
The reports that GTmetrix generates are highly informative, but also exceptionally detailed.
As a result, understanding them can be a bit difficult. Let us make it easy for you by explaining what this information means for you and your website/application.

Assessment and scoring details
The scoring system used in the new GTmetrix report is loosely based on the Lighthouse scoring system.
However, the tests have been improved and slightly modified by the GTmetrix configuration in order to provide the results that their tool provides. The end result is the new GTmetrix report.
The new version of GTmetrix brings a new version of reports. Let's take a look at the reports and look at each section.
This tab is new to GTmetrix reports and shows you a comprehensive snapshot of load performance, structure, and behavior.
You should consider any issues that appear here as actions to be taken. The only information in this section may provide important indications to improve the performance of your page.

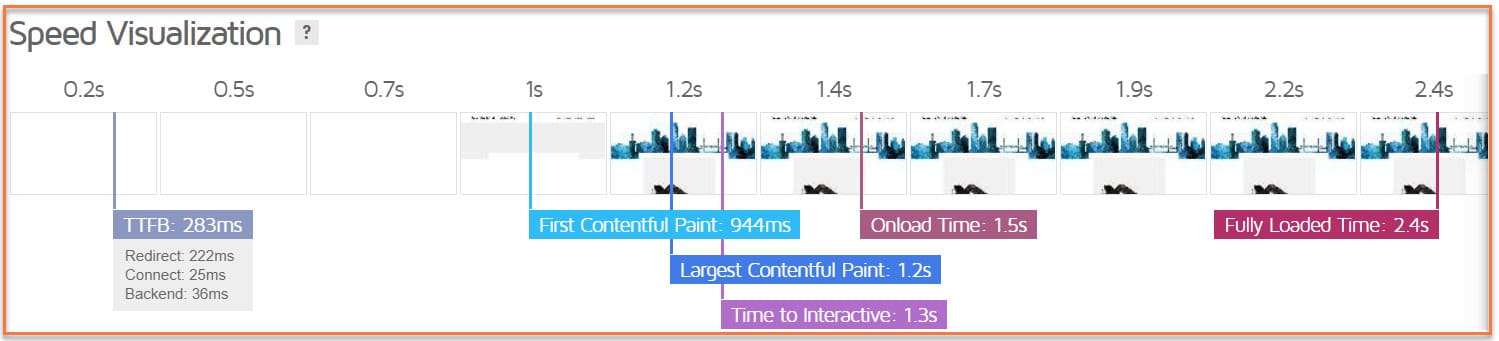
At the top of the report is the speed visualization, which is an interval capture of page loading with flags that mark the various measures of your performance score as your website loads.
Audits have a critical impact on the performance of your website/web application.
Resolving these audits can significantly improve the overall GTmetrix score and performance and structure scores.
By correcting the items suggested by the audits and restore tests, new audits may appear in the issues section
This allows you to prioritize what you want to correct based on the impact on the performance of your page.

The section”Details of the page“shows a graph of the type of requests that make up your page, including the number of requests required to load the web page/application and the size in bytes they represent.
The Page Details section is also very useful for determining if your web page is heavily loaded with resources such as JavaScript, CSS, and images.

If you hover over a particular segment of the chart, you'll get additional information about that type of demand as a whole.
In the updated version of GTmetrix, the Timings tab has been removed and replaced by the new Performance tab, which shows your performance score metrics in great detail!

Each metric on the Performance tab comes with a description (which I've enabled for you to see), so you can see what it means at a glance. Additionally, the indicators are color coded to indicate your performance in this area.
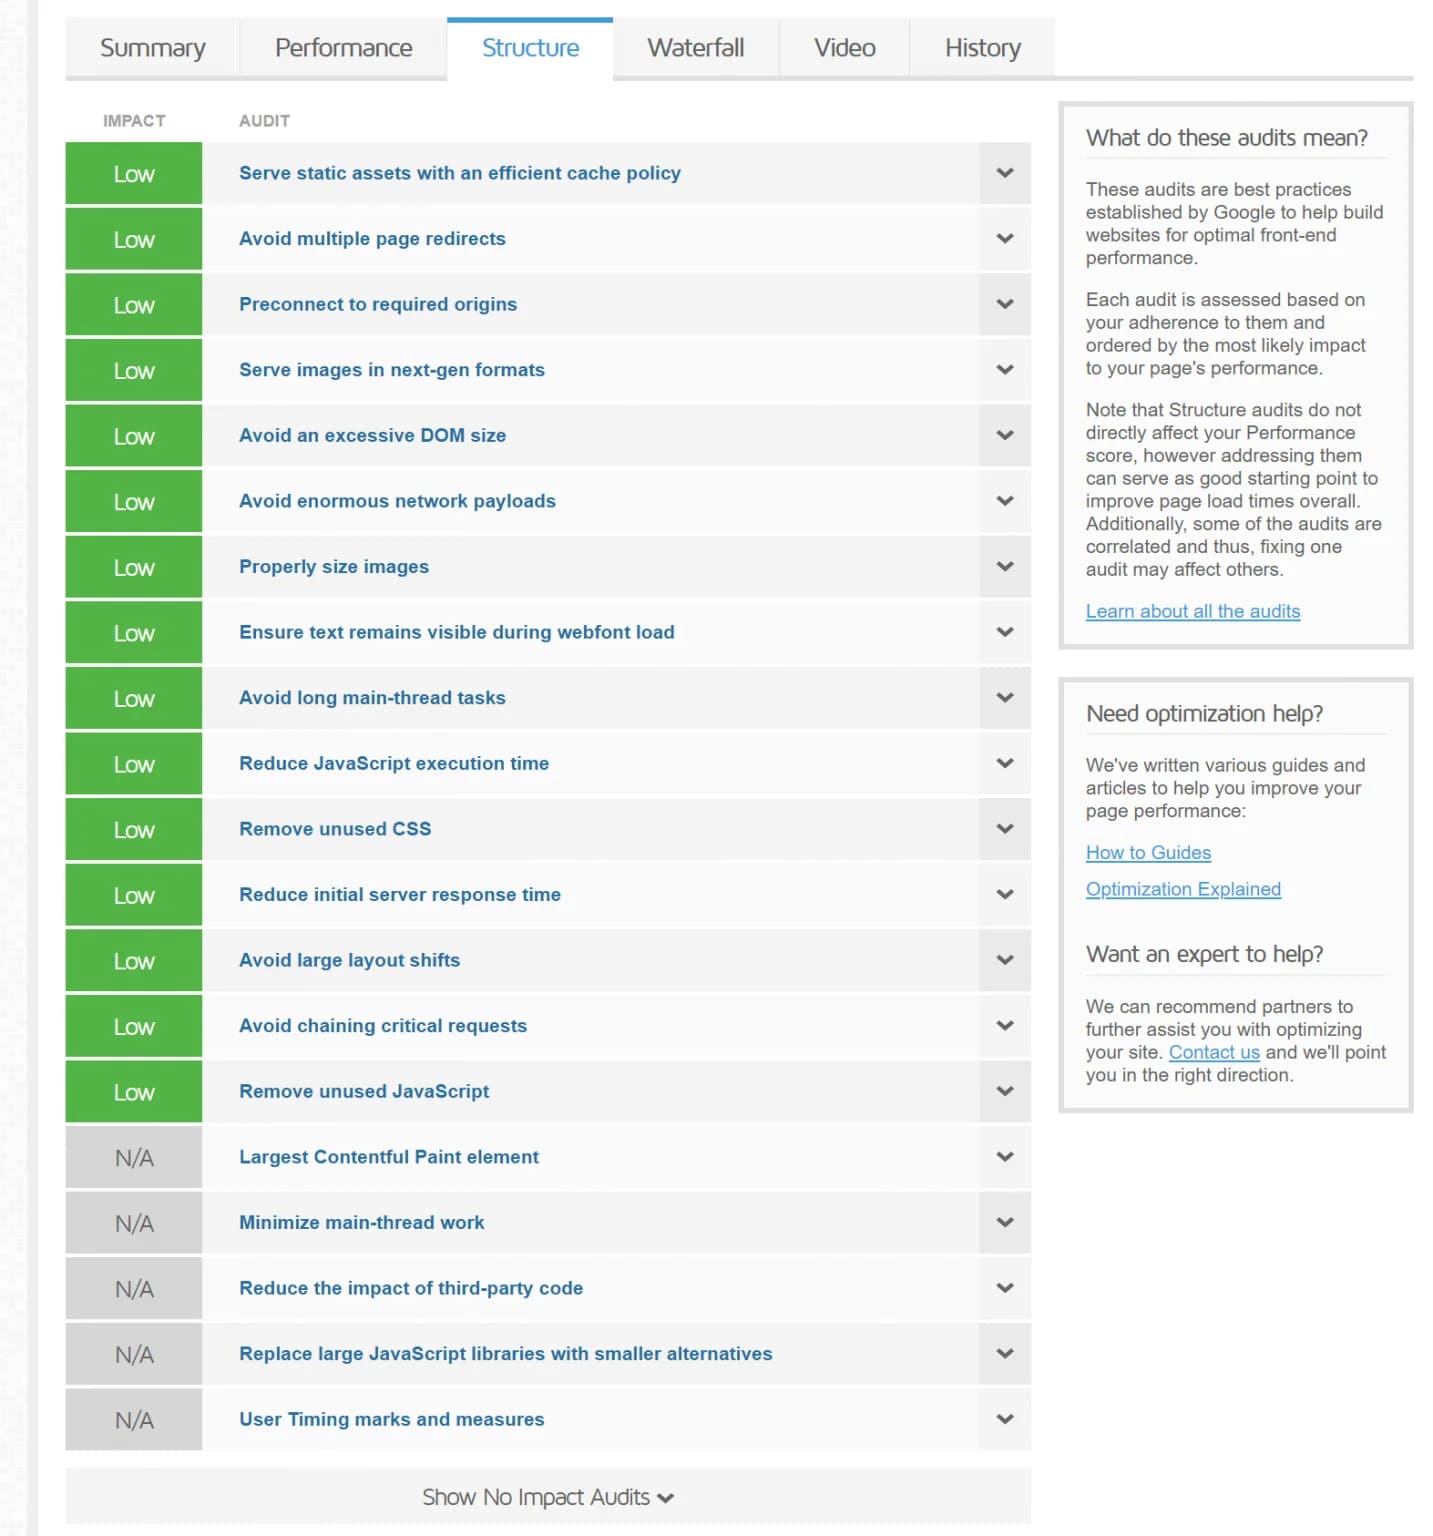
The Structure tab is the successor to the PageSpeed and YSlow tabs in legacy reports, which contain your Lighthouse audits based on structure and best practices for optimal website/web application performance.

The image above is a great representation of a site that doesn't need a lot of work to improve, but your site may not fare as well, depending on how it's set up.
If you have audits that need to be improved, you'll see a tabular layout with all the audits organized according to their degree of adherence, with the underperforming ones placed at the top.
A new feature in this updated version of GTmetrix Reporting is Audit Impact, which is an exclusive GTmetrix assessment that consists of potential savings, an impact on your measurements, and other considerations that you should think about.
Impact essentially represents the extent of the impact of the particular audit on your performance score. They are calculated based on the results of each analysis and then placed within one of the following thresholds:

The cumulative impacts of each audit are calculated and added together to form the page structure score. By clicking on the dropdown menu next to each audit, you will expand on it and reveal the results that contributed to the impact of the audit.

It's all about efficiency and optimization. Your site might load quickly, but it could be even faster if you considered some of the best practices. You might even be able to reduce bandwidth and hosting costs by minimizing your footprint.
Likewise, your site may load quickly but a visitor may not perceive it as such. You need to understand how your site loads so you can focus on providing a positive user experience.
Lighthouse is a tool developed by Google to analyze applications or web pages and collect modern performance metrics and information to help developers optimize the performance of their site or web application.
You can run Lighthouse on any web page, whether it's public or requires authentication. It offers audits of performance, accessibility, progressive web applications, etc.
You can run Lighthouse in Chrome DevTools, from the command line, or from a Node module. Just give Lighthouse a URL to audit and it will run a series of tests on the page and then generate a report on the effectiveness of the page. From there, you can use test scores to make things better. Each test comes with a reference document that explains why it is important and how to correct it.
This version of GTmetrix is the most comprehensive to date on the web and has been completely redesigned to incorporate new Lighthouse test data, which will most likely change the way you assess the performance of your site.
If you need resources on “How to Optimize” your site for better results in GTmetrix, you can always open a ticket from your lab or live chat and ask our happiness engineers to check your site and make some recommendations!
Hopefully, this comprehensive coverage of the new GTmetrix reports will help you better understand what you see when you run a report and that it's not just geeky language for you.