.svg)


Graphic Design Industry Trends: Data and Analysis
The global market for graphic design is experiencing a significant expansion, stimulated by the transition to digital technology and the growing need for effective visual strategies in businesses.
Here are the main trends based on recent data:

- Global Market Expansion:The global graphic design market is expected to reach $73.3 billion by 2028, with a compound annual growth rate (CAGR) of 5.1% between 2023 and 2028. This increase is due to increased demand for visual content for digital platforms and advances in design tools.
- Situation in the United States:In 2023, the American graphic design industry represents approximately $14.8 billion. We count 16,930 businesses in this sector, and the demand for graphic designers is expected to increase by 3% between 2021 and 2031.

- Use of artificial intelligence (AI) :En 2023, 63% of graphic designers use AI tools to automate tasks, such as quickly creating visuals, generating logos, or editing photos.
- Role of design in customer experience:A study shows that 86% of consumers are willing to pay more for a better user experience. In addition, 94% of first impressions are directly linked to the quality of the design.
- Request for motion design and user interface (UI) design:The Motion Design And the user interface (UI) design are experiencing an increase in 17% compared to the previous year. This trend responds to the need to create experiences that are interactive and engaging.
The graphic design industry is evolving with the integration of advanced technologies and the increase in consumer expectations for an optimal visual experience. Businesses are investing more in qualified graphic designers to improve their brand image.
The growing importance of UI and motion design skills, as well as the rise of freelancers, are shaping a dynamic future for this developing sector.
Sectors that need graphic designers
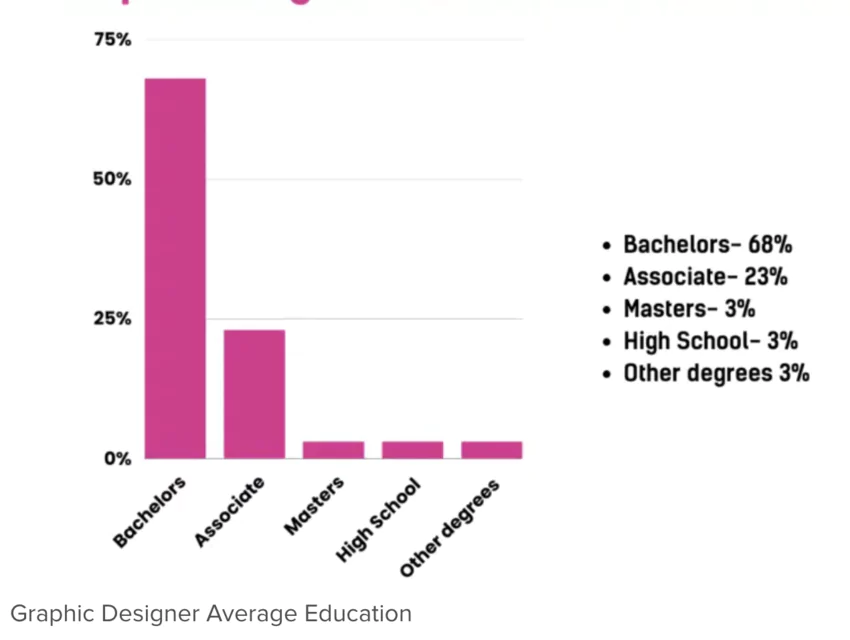
People with a degree or relevant experience can also become graphic designers:
- Creative Directors
- Art directors
- User experience (UX) designers
- User interface (UI) designers
- Production artists
- Product developers
- Marketing specialists
- Multimedia artists or animators
- Designers or developers of websites
- Digital illustrators
- Technical writers
- Photo editor
- Industrial designers
- Designers (engineering and architecture)
- Desktop editors
- Arts and crafts artists
- Logo designer
- Creative Services Manager
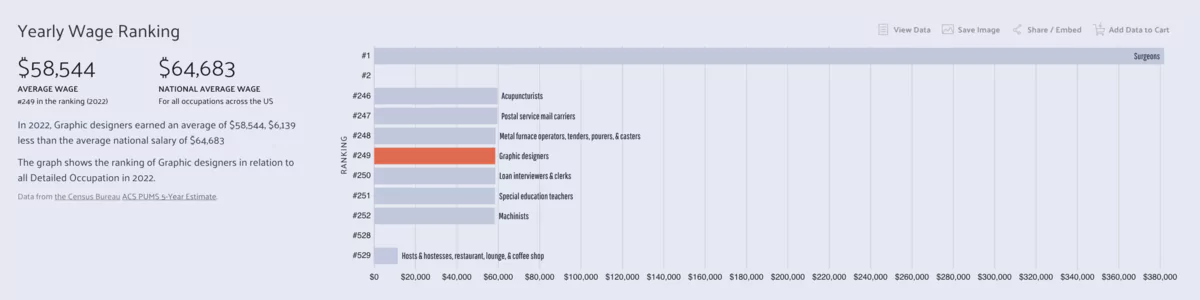
Out of all graphic designer jobs, the top 5 salaries in the United States are as follows:
- User Experience Designer (UX): $92,118 per year
- User Interface (UI) Designer: $79,223 per year
- Logo designer: $52,992 per year
- Fashion designer: $49,762 to $74,796 per year
- Photo editor: $40,699 per year

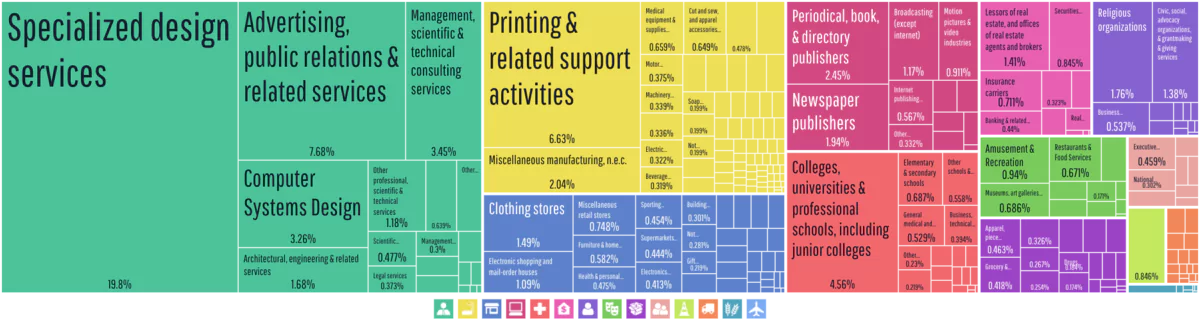
While any industry can benefit from the skills of a graphic designer, graphic designers are often found in the following areas:
- Education
- Publication
- Computer systems design
- Mobile application design
- Governmental organizations
- Publicity
- Manufacturing and packaging
- User experience
Some American industries invest in graphic designers more than others:
- Monetary authorities - central bank: $108,260 per year
- Software publishers: $94,780 per year
- Natural gas distribution: $90,240 per year
- Federal executive branch: $88,430 per year
- Securities, commodity contracts, financial investments, and related activities: $86,730.
However, the graphic design profession is not for everyone, as 40% of people who enter the field abandon it after two years.
- 40% of graphic designers drop out within two years of their training
- Only 60% of the 25,000 people who start a career as a graphic designer last the first two years.
- 1/3 of graphic designers remain in the profession after five years
Statistics on the impact of visual content in digital marketing
Use of visuals in B2B marketing
B2B marketing is increasingly focusing on visual content. 51% professionals in the sector consider the creation of visual resources as a priority in their campaigns.
Some of the most popular formats include:
- The videos, used by 72% Marketers
- The infographics, integrated by 65% Of them
- The illustrations and photos, used by 56% professionals
This diversity of formats makes it possible to adapt to the different communication needs and preferences of B2B audiences.
Effectiveness of visuals for memory and engagement
The impact of visuals on information retention is considerable. Our brains process visual information 60,000 times faster That the text, which explains their effectiveness.
On social networks, publications accompanied by images are shared twice as much than those without visuals. Even more impressive, adding relevant visuals to text can improve the memory of the message of 650%.
These figures highlight the crucial importance of visual elements in an effective communication strategy.

Key challenges in creating visual content
Despite their importance, creating visuals poses several challenges to marketers:
- 36.7% find it difficult to produce charts regularly
- 22.9% struggle to find the ideal layout for their visuals
- 20.5% struggle to maintain an attractive design
- 19.9% have difficulty finding relevant data sources
These obstacles highlight the need for specific resources and skills for quality visual production.
The most efficient visual formats according to professionals
Marketers have their preferences when it comes to visual formats. 40.8% of them consider custom graphics to be the most effective. The videos and presentations are acclaimed by 23.7% professionals.
In contrast, archive photos seem less convincing, with only 8.9% of respondents who consider them to be efficient. This trend suggests a preference for original and tailor-made content.
Trend towards graphic design automation
Faced with the growing demand for visual content, 40% of organizations are looking to automate their graphic design process. This trend illustrates the desire to reconcile quantity and quality in visual production, while optimizing resources.
Automation could be a solution to overcome some of the challenges mentioned earlier, including the difficulty of producing quality visual content on a regular basis.
Branding and web design statistics
Impact of design on first impressions
Design plays a decisive role in the initial perception of a brand. 94% of first impressions linked to a company are directly influenced by the design of its website or its visual elements. This includes layout, logo, and color selection.
The credibility of a brand is also strongly linked to its web design:
- 75% of consumers assess the reliability of a company primarily based on the design of its site
- Users spend on average 6.48 seconds to observe the logo of a company when they visit a website
These figures highlight the critical importance of careful and professional design in order to establish a positive connection with visitors from the very beginning.
Business investment in design around the world
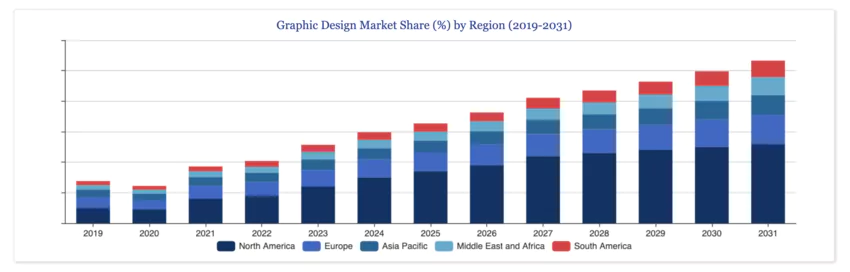
Distribution of the graphic design market by region in the world
Businesses are increasingly recognizing the strategic value of design:
73% of businesses invest in design to stand out from the competition. Those who take a design-centric approach are 69% more likely to achieve their business goals.
However, it is crucial to avoid some pitfalls. 84.6% of graphic designers identify overloaded design as one of the main design mistakes, followed by the absence of call to action (CTA) buttons on websites.
Design and color preferences
User design preferences are varied:
- 59% favor visually “beautiful” designs
- 41% prefer clear and simple designs
Color plays an essential role in the perception of a brand. It can increase the recognition of a brand of 80%. In addition, between 62% and 90% of decisions of consumers are influenced by the color used in the logo.
Factors of trust and abandonment of websites
Consumer trust is closely linked to web design:
94% of consumers say that website design is the main reason why they choose whether or not to trust a business.
Ease of use is also crucial: 6 out of 10 buyers consider the usability of a website to be one of the most important factors when buying online.
Design testing and optimization
Businesses are increasingly using A/B testing to assess the effectiveness of their design choices. These tests optimize visual elements such as layouts, color combinations, and fonts. The aim is to provide a better user experience and improve conversion rates.
These statistics demonstrate the critical importance of well-thought-out visual design in establishing credibility and attracting consumers. Optimizing visual elements is essential for any business looking to stand out in today's marketplace.
Logo statistics
Logo design and visual identity represent approximately $3 billion of the global graphic design market in the United States. Logos are fundamental elements of a brand's image, and first impressions depend heavily on them.
Here are some important facts:
- 60% of consumers avoid a brand if they don't like the logo, even if it gets good reviews.
- Internet users devote approximately 6.4 seconds to observe a logo when visiting a website.
- 60% of Fortune 500 companies opt for combined logos (text and image), a choice adapted to various supports.

Major brands have specific preferences:
- 73% Use sans serif fonts
- 40% include the color blue in their logos
Blue, associated with reliability, is found in the logos of companies like walmart, Ford, and AT&T.
These data highlight the influence of the logo on consumer perception and its role in their relationship with the brand.
Color usage statistics
Using the right colors in graphics can boost website conversions. In a Performable study, call-to-action (CTA) buttons changed from green to red and all other elements remained the same. By simply changing the color, Performable saw its conversion rates increase by 21%.

Likewise, Ript Apparel saw sales increase by 6.3% after changing their CTA buttons from green to yellow. Graphic designers use color theory and psychology to create content that effectively reaches audiences.
- Performable's conversion rates increased by 21% by changing its CTA buttons from green to red.
- Ript Apparel sales increased by 6.3% after changing its CTA buttons from green to yellow.
- In 90% of cases, the first instinctive reaction to products is based on color alone.
- Color can improve reading by 40% and increase comprehension by 73%.
- Colourful logos are 80% likely to increase brand awareness.
Graphic design software usage statistics
Captivating visuals are intriguing the audience, and the drawing software are practical graphic design tools.
How long does it take to create visuals?
- 50% of marketers spend less than 5 hours
- 22% spend 5 to 10 hours
- 29% spend 10 to 20 hours
Most used graphic design software
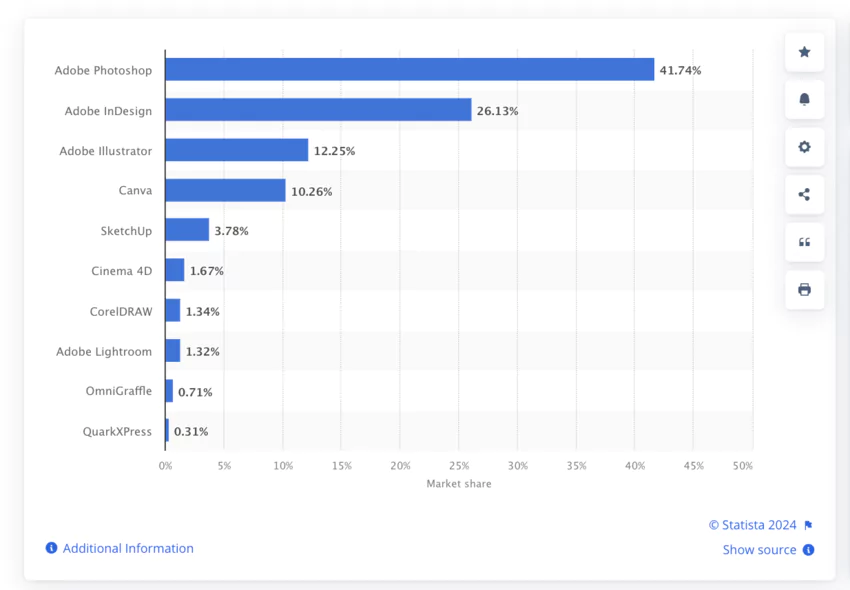
- Adobe Photoshop : 41.74%
- Adobe InDesign: 26.13%
- Adobe Illustrator: 12.25%
- Canva : 10.26%
- SketchUp: 3.78%
- Cinema 4D: 1.67%
RECOMMENDED READING: Free background removal tools
Social media marketing
Social networks are a source of news, entertainment, communication and inspiration, which is why they have become a platform for digital marketing. As social networks are one of the most popular online activities, the number of users is expected to reach 4.41 billion by 2026.
- By 2026, it is estimated that there will be 4.41 billion social media users.
- With more than 3.6 billion potential consumers in 2020, graphic design is essential to be competitive on social networks, a competitive landscape.
- Internet users spend an average of 144 minutes per day on social networks and messaging applications.
- 80% of markets use visuals in their social media marketing
- People are twice as likely to share video content as other types of content.
- 84% of consumers agree that promotional videos convinced them to make a purchase
Consumer behavior and the impact of visuals on websites
Multi-device and mobile use in e-commerce
Using multiple devices for online shopping has become the norm. 85% of consumers aged 18 to 49 browse and shop using multiple devices simultaneously. This trend highlights the importance of a consistent visual experience across all media.
The mobile plays a major role:
- 50% of turnover of online stores come from mobile devices
- However, mobile conversion rates remain lower, mainly due to pages that are too slow and overloaded.
This data highlights the need to optimize sites for a smooth and fast mobile experience.
Bounce rate and the impact of loading speed
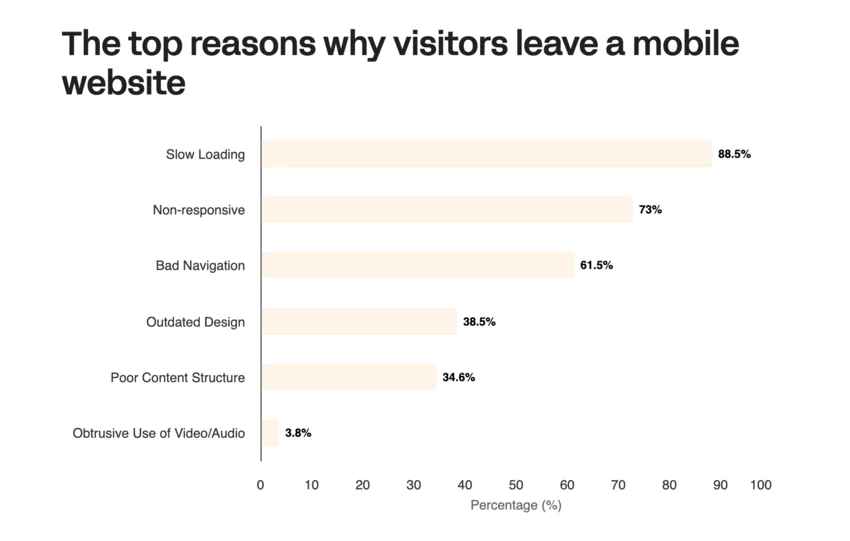
Why do visitors leave a mobile site
The loading speed of a website has a direct impact on the bounce rate:
If the load time increases from 1 to 3 seconds, the probability of a bounce increases by 32%.
This probability increases to 90% for a 5 second charge, and at 123% for 10 seconds.
These figures highlight the crucial importance of optimizing the performance of a site to retain visitors.
Influence of visuals on the user experience
Visuals play a decisive role in consumer behavior:
- 92.6% say that the visual aspect is the main factor influencing their buying decision
- 94% leave a site if they find its design unprofessional
- Investments in user experience can generate an impressive ROI of 9,900%
These statistics demonstrate the paramount importance of an attractive and professional design for the success of a website.
Design preferences
Consumers have high expectations when it comes to design:
- 66% prefer “beautifully designed” sites
- 65% of the world's population are visual learners
It is interesting to note that you only need 50 milliseconds to a user to decide if they will stay on a site. This first impression, based on visuals, is therefore crucial.
Credibility and website design
The credibility of an online brand is closely linked to the design of its site. 54% of consumers believe that the absence of contact information reduces the credibility of a brand.
A/B testing is widely used to assess and continuously improve various aspects of design, such as layout, color combinations, and fonts.
In conclusion, these statistics highlight the crucial importance of optimized, fast and attractive web design in order to capture and retain the attention of consumers in an increasingly competitive digital environment.